Showing posts with label deflation. Show all posts

Thursday, May 27, 2010

The Great Australian (ponzi) Scheme

Back in February 2008, while the so-called GFC was taking hold I posted at length stating several reasons why I believed the Australian Housing (bubble) market was destined to burst. This post will extend on previous thoughts.

Raise your hand if your living the Great Australian Dream?

In past decades the Great Australian Dream became reality for many who rode the debt wave of the 1970s, 80s and 90s. The dream was an expression of financial security as nothing was "as safe as houses". Fast forward to today and Generations X, Y, and Z have little more than a pipe-dream of affordable living and affordable mortgages. We have to try to keep up with the Jones (Baby Boomers), or complain from outside (like i'm doing here). For now, some younger Australians may do well in the short term by embracing government first-home owner handouts, multi-decade low interest rates and other incentives to try to live the dream... and for now Australia is apparently defying gravity. I believe the dream will cause long term indigestion for some, for decades to come if people do not have a backup plan once asset deflation hits Australia on mass. Liquidity on hand will be king (gold/silver not Australian Dollars).


2009 – house prices hesitate and take off again.

Australian house prices ended up rising 1http://scottreeve.blogspot.com/2009/02/beware-australian-housing-debt-bubble.html, the fourth highest growth rate in the world behind Hong Kong, Mainland China, and Israel. However, globally house price deflation continues with house prices falling by 3.8 per cent, led by Ireland, Dubai and Eastern Europe. In my post last month, there is an excellent graph highlighting the next wave of delinquent mortgages on the way (1 in 7 trouble). China will follow, and i'll post more extensively on its problems.

Chart 1:
source: Australian Financial Review, March 2010

Chart 2: Australian house prices by city
source: ABS

Chart 3: The dip and the rebound...
source: ABS

The great Australian ponzi scheme continues upwards again. The combination between unprecedented population growth, low housing starts, government handouts, very low (central-bank manipulated) interest rates, and double-digit M3 inflation growth in the system (during the GFC period) ensured that there would be enough fuel to get more buyers into the Australian housing market. Externally, more and more money is coming from businessmen in China, India and elsewhere whom currently see Australia as a place to invest their savings for a return.

Lets examine each of these issues more closely.

A) unprecedented population growth

Chart 4: 300,000 to 400,000 net new people each year now... lets make the aging population problem (and hospitals) worse.
source: ABC News

Chart 5: Govt: "Even if there wasn't a "real" shortage... lets create one"...
source: ABC News

That's a lot more people that need to consume and a roof over their head. A lot more people that might be bringing valuable skills to Australia right now (a quick fix? ...), but eventually will also add to the hospital cues (and potentially unemployment ques when the economy goes pear shaped). The aging population is still aging!

B) Housing Starts manipulation

As the following graph demonstrates, the three levels of government have successfully been manipulating the supply-side of the housing market, by staging land releases. Arguably, the three levels of government in Australia are the most addicted to keeping Australian housing prices upright, and the most to loose when asset-deflation sets in. Primarily, strong price growth in housing equates to overall consumer confidence in the market, and ultimately confidence in government economic management. Further, local governments remain fixated on housing rates to raise revenue to spend on local roads, while revenue-deprived state governments grow increasingly reliant on land and stamp duty taxes. A blow in confidence in the housing market is a blow to government revenues (direct taxation), but ultimately a total decline in confidence will flow through to less employment (income tax), business profitability etc.

Chart 6: It's in Government interest to not flood the market with too much land...
source: ABC News (RBS data)


C) Government handouts – 1st homer owner loans

In the first stimulus package (A$10.4bn) announced in October 2008, the Rudd Government introduced a First Home Owners Boost to go onto of the First Home Owners Grant. With interest rates cut to four decade lows, this just added further candy to the honey pot to entice young Australians into the housing market. I'm a graph person, and I found the following interesting to decipher. Government's throwing money at problems just disrupts market behaviour. When the Government intervention is removed, the market goes back to levels before their intervened.

Chart 7:
source: Australian Financial Review (analysis added)


D) Very low interest rates

Unfortunately, the four decade low interest rates set by the Reserve Bank of Australia has encouraged more and more Australian to take on ever larger mortgages. Lowering interest rates has had a very significant influence on keeping Australia’s housing prices upright during the GFC and post-GFC period. If the RBA did not intervene in the market to lower interest rates (essentially adding more liquidity, more Dollars to the market), than many Australian’s would not have entered the housing market, or bought addition properties. The RBA is nothing more than a market manipulator, to manipulate investors decisions and to disrupt real market information.


E) Double-digit M3 inflation growth

In one of my first posts in September 2008, I talked about money supply growth and that it was growing at the fastest annual rate since the 1970s. This was in part due to the housing bubble that has continued. But the dip in housing between March 2008 and March 2009, the drop in confidence during the GFC period, the rise in unemployable and underemployment,, and the reduction in bank lending in Australia cooled M3 growth. Right now the annualised rate is back to 5.7 per cent. So the volatility continues. I expect M3 to grow strongly once again (similar to 1970s), and ultimately will go crazy as Government's get desperate to bail out certain industries... Inflation always has a 12-18 month time lag... so even though it may be growing more slowly now, the overall costs of living continue to rise. I don't see milk or rents going down..


Other interesting tid bits:

Steve Keen walks to Kosciuszko from Canberra


Where to from here?

May 2010, the sharemarket is looking shaky with the Dow Jones breaking back below 10,000 point level. Housing market quarterly growth continues in Australia for now... But I ask, what has structurally changed from 2-3 years ago? Structurally nothing has changed in the world since before, during and after the GFC. The United States only continues to live beyond its means because it has the world reserve currency, and can print its way out of trouble for now. Europe, Japan and others have held up until now because confidence in private and government debt has been suffice to keep the current ponzi-fiat-monetary system going. People are waking up to this, and volumes of gold, silver and other so-called "relics" sales are going through the roof (mint-door sales). Real estate markets worldwide continue to fall in local-currency prices - Hong Kong, Mainland China, Israel and Australia are still the exception... for now. Deleverage of over-inflated asset prices will continue (derivatives....), and many more AIG, Lehman's are around the corner - this time Government names will be added to the list (just not officially). Australia looks good for now, but this can quickly change over night. Putting all our eggs in the one basket - superannuation, real estate and relying on exporting commodities to China will inevitably cause major problems for us (Australia). China's centrally planned economy will blow up, they cannot spend, spend, spend, just like the US tried to do with retail consumption and sub-prime. Populating, (retail) consumption and inflating our way through the GFC appears on face-value to work, but it is only postponing our problems: Aging population, consuming the future today (we have no private savings), and increasing our costs of living by diluting our money supply. Now is the time to find value in markets....... I don't think the next 20 yrs will be like the last 20 yrs. Printing money can only cover up so much for so long...

The great Australian dream will turn out to be nothing more than the Great Australian Ponzi Scheme.

Scott
Thursday, May 21, 2009

Accounting for deadwood

One of Australia’s great ponzi schemes is toppling. In the last two months, the two largest Managed Investment Schemes (MIS) have entered administration; Timbercorp (23 April 2009) and Great Southern Plantations (15 May 2009). Fortunately these companies have been allowed to fail. The market is accounting for deadwood in the system.

The MIS industry prospered over the last decade purely as more investment flows came into the companies each year by paying high short-term returns at the expense of long-term balance sheet sustainability (from future profits).

In many ways, the MIS industry is akin to the Babcock and Brown or Allco Finance model. Take low yielding assets that have a long investment time frame, sell the assets to investors on the sharemarket, inflate the yield numbers over the short term, and skim large amounts of fees off the top. This model worked brilliantly when the economy (and the money supply/credit/debt) grew consistently and individuals looked for investments to expand their wealth. Now the debt model is broken and the MIS industry has been exposed as a complete fraud.

However, the real fuel on the fire was the lure of a tax break. The tax rules on MIS schemes in the 1990s early 2000s made it ideal for investors who wanted both an investment and a way to minimize tax. In a way it was a voluntary savings scheme (similar to Superannuation), the scheme mangers were almost guaranteed to get a growing number of buyers for their schemes each year.

Like all ponzi schemes, the system starts to show huge cracks when the liquidity of buyers starts drying up.

The first major crack was an ATO crackdown in February 2007, which prevented non-forestry MIS (such as almonds, olives) from receiving upfront tax deductions. The increased uncertainty created from this no doubt have a significant impact on the financial sustainability of the MIS industry.

The second crack was under delivering investors. When the first timber projects were harvested, yields were well down on what investors were told a decade earlier. The assets (the trees) were considerably less valuable.

Third, both Great Southern and Timbercorp took on substantial debts to keep the schemes going. Taking on large debts (with less investor equity) in the boom times worked (ala B&B model). As we know with the Global Financial Crisis (GFC), debt-based models are no longer sustainable and companies are now rushing to raise equity at any cost. The MIS could no longer raise any credible equity or debt and the great ponzi scheme has been felled.

It turns out Timbercorp and Great Southern became the biggest of the MIS schemes because they were the best at selling schemes (with the tax break lure). As it turns out, they weren’t in the business of making fat profits via harvesting – ie. what investors were led to believe.

As an example of the largess of the industry, Great Southern spent $62.3 million on commissions, marketing and promotion of its products in the year to September 2008.

However, despite the commissions, fees, tax breaks and other incentives, lets not forget that the agriculture and forestry industry, like any investment, has risk.
The risk/reward relationship changed for the MIS industry substantially over the last 10 years. Risks were overlooked in the earlier years because of the lure of the tax break. Without the tax break, it is now known that TIM and GTP were high risk/low (no) reward investments.

Further, Agriculture and forestry is susceptible to serve weather conditions, particularly drought. This has no doubt impacted on expected yields and expected future profits. The 62,000 investors caught left holding worthless paper when the music stopped, like any investor, have to take personal responsibility for their investments. The financial/investment industry has its fair share of bad advisors who give bad advice on bad investments. Economists also don't have a crystal ball about he future on tax changes, climate influences etc. Investing is also about timing and discipline. Every investor must have an exit strategy for when things start to go wrong. As we now know the investment world no longer tolerates high debt companies. For instance, Timbercorp had debt gearing of 62.4 per cent in 2007. The charts of both Great Southern and Timbercorp show investors have been deserting the companies for the last 3 to 4 years.

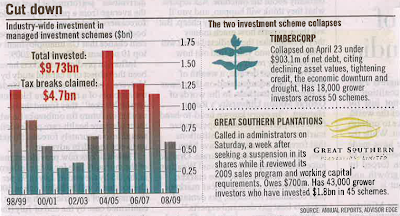
All up over $10 billion in investment flows went into the MIS industry over the last decade, with and estimated $4.7 billion in tax breaks received.

As the following graphic details, Timbercorp fell with over $900 million in debts, while Great Southern owes around $700 million.

Chart 1: Total invested in MIS in last decade
source: Financial Review, 19/05/2009, page 61

Chart 2: Timbercorp’s investmentssource: Timbercorp website

Chart 3: Great Southern’s investmentssource: Great Southern website


Deflation to hit rural property prices

I’ve discussed a number of times that I believe there were continue to be deleveraging of debt across Australia and the world. All types of property in Australia are at high, immediate asset-deflation risk (commercial, industrial, residential and rural properties).

The collapse of the two largest MIS schemes should have a significant impact on rural land prices across Australia. During the last decade, MIS has been criticised by many rural communities for pushing up land prices (due to their investor and bank backed purchasing power) and accelerating the decline of many rural communities. Traditional farmers could not compete on land purchases, and many of the best grazing properties were turned into hardwood plantations.

Now with the collapse of Great Southern and Timbercorp there is talk of an immanent fire sale. Great Southern has 240,000 hectares, while Timbercorp has 120,000 hectares of property. Just like a bank taking back a default home mortgage, they will not be interested in holding onto all this surplus property. It will be dumped onto the market for whatever price they can get. We now have a reverse outcome to the last decade. The buying force of a the MIS industry pushed prices up dramatically, are now crossing over to the seller side. When administrators/banks are the sellers, lookout below… Severe asset-deflation is coming. The only hope is if a major foreign investor showed up to buy most of the assets.

Debt will continue to be the downfall for many individuals, businesses, and even Governments. Timing and discipline is key. We are no longer in a debt cycle.

- Scott

Tuesday, May 5, 2009

The Inflation vs. Deflation Debate

There are a lot of articles going around about whether the world economy is facing Inflation or Deflation. Here is my take on the situation.

It’s asset-deflation

Deleveraging of financial assets worldwide has been driving short-term deflationary pressures on world money supply. I label this as asset-deflation or debt-deflation. Deflation has a snowballing effect. It comprises of:

a) Illiquidity
. When buyers hit the sidelines on expectations that prices will fall lower in the future.

b) Spreads Widen. With buyers drying up, the difference between what the nearest buyer is willing to pay and what the seller expects to get paid widens. For example, someone may believe their house is worth $500K, but the nearest buyer is now at $400K, causing a spread of $100K. In other words, the house is only worth what the nearest buyer is willing to pay!

c) Many sellers exit the market at almost any cost. In a rising market, buyers out bid each other to acquire an asset. In a deflation environment, many sellers are forced into a position to sell to the nearest buyer (even though it may be vastly under what they believe their asset is worth). There doesn’t need to be many sellers in an illiquid market to make prices fall sharply (just like a lack of buyers). For example, if someone forecloses on their mortgage, the bank will offload the property back onto the market and get what ever it can. As unemployment rises, mortgage default rises, the quantity of surplus properties in bank hands rises. This causes more asset-deflation.

Baby Boomers

More so in the future, demographics will be a major influence on asset-deflation. The Baby Boomer generations is the largest living generation in the United States, Australia and many Western economies. As they move into retirement at the end of their working life, many will sell down their properties, businesses, and shares (held in the Superannuation accounts). However the following generations will be unable to match this selling pressure as they are starting our/half way into their working life. This factor alone will ensure the next 20 years will be vastly different to the last 20 years for financial (DEBT) driven assets.


Asset-deflation should be embraced

Prices have been lifted artificially high for too long, and now the market forces are accounting for misallocation of capital.

Governments, central banks, commercial banks and individuals fear asset-deflation. This is why the Australian Government is guaranteeing deposits, the States debt, forming a Rudd-bank (commercial property fund). The aim of the Federal Reserve (and central banks worldwide) is to ensure property has soft landing so people feel wealthy again. They now want to prevent massive asset bubbles from bursting as it will destroy the artificial wealth effect.

artificial wealth effect - the general population get angry when food prices, rent prices continually inflate (because of an expanding money supply), but also dislike when the sharemarket and property values fall in price (again, due to an expanding money supply). We can’t have it both ways.

Historically property prices are said to double every seven years. What is never mentioned is how much the money supply has grown every seven years, or how our purchasing power has decreased every seven years. For example, if you buy a property for $100K in 1988 and sell it for another house in the surrounding suburb, you would have to pay around $100k for a similar house. Come forward to 1998, that same house is now worth $200K, but if it were sold, you would still have to buy a similar house in that area for around $200K. House prices have doubled in this 10 year example, but overall purchasing power decreased as the M3 money supply more than doubled. This is an artificial wealth effect.

A couple more points. The 1970s and 1980s were ideal times to acquire and invest in property and the sharemarket. The market was in a Debt-cycle. From 1982 to 1999, commodities were largely lousy investment and lost purchasing power. The two cycles have an inverse relationship. We currently remain halfway through an average commodity cycle. The purchasing power gains will continue to occur for gold, silver and most commodities, while the purchasing power of investing in the sharemarket and property will continue to decrease.


By design the system must inflate

The monetary system is designed to inflate over time and reduce our purchasing power. The system is mathematically designed on an exponential growth curve.
These factors include: fractional reserve banking, mandatory savings scheme, government monetary/fiscal power.


i) fractional reserve banking
.
Every time someone signs a new mortgage or a new bank loan, new money is created right there and then. Fractional reserve banking is at the heart of the flaws in today’s monetary system. By design, all debts can never be repaid. Exponential credit (debt) is guaranteed. Therefore many nations, businesses, individuals will remain in spirally debts and bankruptcies.

“The most powerful force in the universe is compound interest” - Albert Einstein

ii) mandatory savings scheme (Superannuation)
Superannuation, Government Funds (such as the Future Fund) artificially inflate asset prices over time as they provide excess liquidity to the market and a guaranteed source of continual investment. By design, these schemes also need asset prices to inflate in price.

iii) Government monetary and fiscal power
The reason we have such extreme volatility in the economy is that Governments central banks, commercial banks try to re-inflate bubbles whenever market forces try to account for bad debts through asset-deflation. Central banks (through monetary policy) around the world are currently lowering interest rates in a desperate attempt to manipulate investor decisions, to draw more financially able investors into the asset-deflation black hole. Central banks/Governments aren’t lowering interest rates so people buy more food or enter the rent market. The monetary framework today is all about saving the PRICE of financial assets (debt).

Through fiscal policy, Governments are giving financial incentives (free handouts - free as in using taxpayer money…), such as the first home owner grant to artificially keep house prices high. In the future (its already happening…), these insentives will be funded by Government-debt.

These actions ensure the longer-term money supply will inflate over time and that debts will become increasingly unsustainable.

iii) a) the US Government is insolvent

The US Government currently has a national debt of US$11.2 trillion. Right now the US Government is spending almost. In 2008, the interest repayments on the national debt is US$431 billion (around 14 percent of the annual budget). When you add future liabilities (of an aging 80 million US baby boomers) such as Medicare, Medicaid and social security – debt liabilities total over US$65 trillion.

The US Government cannot escape its debt situation without borrowing more debt. The Government will never consider reducing Medicare or pension liabilities. The result – more money has to be created, and purchasing power must continue to decrease.


Cause and Effect

Economics is all about cause and effect. Unfortunately many (including our current PM) do not understand both elements.

Fractional reserve banking, mandatory savings scheme and Government monetary and fiscal power are all causes. The consequence is Inflation (loss of purchasing power).

Likewise, many journalists continue to ignore the root causes of deflation, but are fixated on reporting the effects of (asset) deflation. For instance, many are now writing up articles about how wages are falling across many Western economies. Wages just don't fall on their own. Wages are falling as a consequence of something else happening. That is, businesses are collapsing due to DEBT, the drying up of liquidity in markets (including debt markets) and as a result, demand is collapsing. Consequently, as the number of unemployed rise, wages come under pressure as they should.


The CP”lie” – is money supply deflating?

Another mechanism now entrenched in today’s monetary system is the constant dilution (manipulation) of Government statistics. Unfortunately Governments and media are now fixed on the Consumer Price Index (CPI or CP-“lie”). It’s the intention of Governments (and thus the media) that it is possible to sell the idea of deflation through manipulated statistics (particularly CPI).

Currently in Australia, the official CPI rate is 2.5 per cent.


Australia’s money supply is still inflating

In the year to March 2009, Australia's money supply:

Broadmoney 12.4 per cent;
M3 increased by 15.1 per cent;
M1 increased by 8.1 per cent.

There is no deflation in the money supply numbers. It's all on the RBA website. It's the media's fixation on CPI that a drastically diluted scenario is continued to be created. We will never hear what real inflation is doing through the mainstream media.

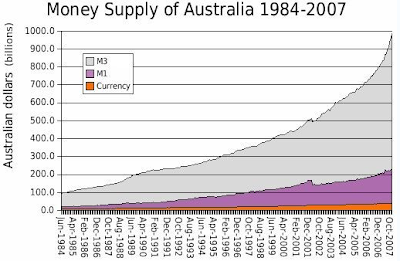
Chart 1: Exponential curves keep expanding
source: Wikipedia

Chart 2: A chart from my second post last year.
The above chart shows the annual grow rates of Australia's M3 money supply. It's not a conincidence that both the sharemarket and property market continued to bubble in the last couple of years (as M3 grew at a faster rate). Expect M3 volatility like the 1970s over the next couple of years (at least).


Japan’s decade of deflation?

Money supply has consistently increased in Japan during the last couple of decades whilst it has experienced deflationary pressures. Asset prices (property, sharemarket remain well below the bubble levels of the 1980s). As the following chart shows, the inflator mechanisms of fractional reserve banking, monetary and fiscal policy etc have meant that Japan's money supply has continued to grow even those asset prices are still subdued.

Chart 3: But the money supply is still growing?
source: Wikipedia

Japan has already been through much of what the Western World is now facing: significant asset-deflation. (Obviously there were other issues going on such as the zombie banks, several stimulus measures etc which I will go into more depth another time).

Summary:

Assets worldwide are being deleveraged and revalued by the market. Asset-delfation is healthy and should be embraced by Governments, banks and individuals worldwide. The market is accounting for excess money and debt in the system.

In Australia the current CPI is 2.5 per cent p.a., banks are offering around 4 per cent interest for savings. Official M3 data shows overall money supply inflation is 15 per cent p.a.
- Aren’t our savings going dramatically backwards in the bank?
- The RBA shouldn’t be reducing interest rates!

Ultimately when it comes down to the inflation/deflation debate, ask yourself this:

* Will the Australian Dollar (or other fiat currency) increase or decrease its purchasing power in the next couple of years? (in this "deflationary" environment). How much stuff will it buy in the future compared to today. This is the crux of the issue.

Remember there is a huge difference between price and value.

- Scott

Wednesday, October 1, 2008

Can't see the forest from the trees

Can't see the forest from the trees

In Australia today, we are being reassured by the Australian Government that "Australia is different", that we can "weather the financial storm in the United States". This can't be further from the truth. The economic/financial systems in Australia are essentially identical to the economic/financial systems in the US, Europe and around the world. The immediate fallout from the US, so far, is in our sharemarket, and consequently, in our retirement savings (superannuation).

There are differences in regulations between countries, but regulations cannot prevent the market from what it wants to do. If the sharemarket wants to plummet. It will plummet. Central banks and governments try to influence and manipulate markets, and they fail time and time again. They try to put a bandaid on problems such as the sub-prime crisis, without looking at the root causes. Governments are essentially powerless to the market forces. You cannot change the direction of the tide.

Is the Australian economy strong today?

- Our unemployment rate is 4.1% (seasonally adjusted)
- We have 10.7 million workers and 457,000 unemployed;
- "Official" CPI inflation rate is 4.5% (year end to 30 June 2008);
- Exports are growing strong, but so are imports; and the
- Australian Dollar has been strong compared to most currencies in recent years.

These numbers still sound great, except inflation has gone well over the 2-3% RBA target band. Australia now has very low unemployment, and retail spending is still buoyant. Export values are climbing fast. Today, we feel more distant from the problems in the US. We cannot see the forest from the trees because the current good times have been going strong since the early 1990s. Look at the big picture!

We cannot ignore what is happening in the US. It will affect us in a huge way… it’s a matter of timing. Wait for when the unemployment rate will turn around and head towards 7-10% again. Inflation is already on the rise. With high inflation and more people unemployment, foreclosures in Western Sydney and Melbourne will become more frequent. The wheels will start to fall off.

Is the economic data reliable?

As I have stated previously, politicians, scientists, journalists or whoever can bend facts to make their argument look better then another person's argument. One scientist can use one set of data to try to prove climate change is man made, while another scientist could use a longer data set to prove climate change is a natural, cyclical process. It's the same with inflation and unemployment data. Numbers are based on methodology and reliability.

Measuring Inflation

Lets look at inflation. Is it really 4.5% in Australia today? It might be if you have full confidence in government.

Inflation in Australia is measured through a the Consumer Price Index (CPI). It measures quarterly changes in the price of a "basket of goods and services". Items consumed by the CPI population group (capital cities) include things such as: food, health, housing, household contents, alcohol, clothing, and transportation. Common items such as milk, bread, cars, petrol are collected monthly as they can be quite volatile in price.

Your spending habits may be completely different to what's in the basket. A family renting, with 3 kids under five years, spending $20 a week on milk will have different spending habits to a retired couple who has no mortgage, and is travelling around Australia (for this couple price inflation for food and fuel will vary greatly around the country). I believe CPI does not represent the true cost of inflation. Ask farmers what the price inflation of fertiliser has been in the last 12 months, or ask manufacturers who are buying steel. A lot of the inflation in the economy has been in input prices (fuel, commodity prices, wages etc.), not output prices (what end users will pay).

At its most basic level, I previously mentioned that Australia's money supply expanded by 23% in the year to end June 2008. This tells us there is a lot of inflation coming to Australia very soon. In this year alone the 23% extra money in the pool has to "find a home". It will compete with existing money to push up rent prices, food prices, property prices etc. Real inflation is much worse then the CPI is telling us.

In Australia, the CPI method was first introduced in 1960. Since this time the CPI has been reviewed and reweighed 13 times – generally every 5 years. In 1998 for instance, several major changes were made to the index. That is, CPI changed from measuring living costs of employee households to a general measure of price inflation for the household sector as whole. Changing the methodology, and changing what's in the basket and outside the basket, changes the outcome. The same happens with measuring unemployment rates. Changing the defition, changes the published unemployment rate. We cannot easily compare apples today to apples fifty years ago, because the apples today have been diluted.

CPI is just like what happens on the sharemarket. Standard's and Poor's (S&P) review and reweigh their share index's four times a year. Take the ASX top 100 stocks. If a stock has performed badly it is removed from the index and replaced by a better performing stock. For instance, Centro Properties was removed recently because its share price has fallen 91% in the last 18 months. By removing the bad companies (or items) out of the index, you can make the index look better over time then what it would be otherwise.

What we must do instead is measure items in terms of our purchasing power. Today, a lot more households have two breadwinners to try and pay off the mortgage and to meet expanding debt liabilities. A few decades ago, most households had one breadwinner to pay the mortgage and everything else. Back then there were no computers or plasma's, but people still bought houses, cars and food. Are we really any more prosperous today? Cars and restaurants might be fancier today, but they still serve the same purpose.

Inflation in the United States

Like Australia, the US has constantly reviewed and reweighed how it measures inflation. The following charts shows this quite clearly.

Chart 1: Real Money Supply Growth in the US
According to shadowstats.com,m3 money supply growth in the US grew by 17% in 2007. Remember from my previous post, the US stopped publishing M3 money supply in March 2006. This is the fastest rate of money supply growth the US has seen ever. This new money (including the $700bn if approved by Congress) has to find a home in prices somewhere...

Chart 2: Real Inflation in the US
According to shadowstats.com, if the US did not keep diluting its CPI measures, real inflation in the United States today would be around 14% per annum (blue line), vs what the government tells us (red line).

Chart 3:
CPI today compared to pre-Clinton administration.
So the pre-clinton CPI would be about half-way between the red and blue lines in Chart 2. Obviously Government is keen to dilute the facts more and more often (as the news gets worse).

Extreme Price Movements

There are 2 main types of extreme price movements and economy can experience.

1) Deflation

Deflation is the opposite to inflation. It is when there is a contraction in money supply (a decrease in prices of goods and services). Money is becomes illiquid and does not flow.

2) Hyperinflation

Hyperinflation is extreme inflation of prices. It is when prices are increasing by 1000% or more per annum. Think of what's happening in Zimbabwe today. It's money supply is currently doubling in price every 28 days. So if your home is worth $5 million today, it will be worth $10 million in a month's time. You will not be any more wealthy, just the opposite. Purchasing power erodes rapidly during hyperinflation. Wage increases wouldn't be negotiated yearly; they would be negotiated fortnightly or weekly under hyperinflation – just to keep pass with increases in the cost of living.

Old and new words

For the last few decades the media has largely used terms such as inflation and recession. ie. mild hike in prices, and mild economic downturns. These words will be replaced in coming years by hyperinflation and depression. We are heading for "extreme" inflation and a "great" depression (GD2?). Governments, the media, and the people will have to change their context and get with the times...

The next Great Depression will be characterised by hyperinflation

The last Great Depression of the 1930s was a deflationary one, characterised by prices collapsing. The next Great Depression will likely be more along the lines of what is happening in Zimbabwe today, or in Weimer Germany in the early 1920s. The 1930s Great Depression was deflationary because the gold standard invoked monetary discipline, whereas today, the limitless printing of money will create hyper-inflationary pressures on prices. Both deflation and hyperinflation cripple purchasing power, employment and the normal functions of an economy.

For some great to-the-point commentary on the current economic environment in the US and where we are heading, I strongly recommend reading John Williams (of Shadowstats.com) Hyperinflation report (of April 2008).

Williams states that "what promises hyperinflation this time is the lack of monetary dicipine formerly imposed on the system by the gold standard, and a Federal Reserve dedicated to preventing a collapse of the money supply and the implosion of the still, extremely over-leveraged domestic financial system."

Williams believes the US will experience hyperinflation as early as 2010, if not before, and likely no more than a decade down the road from today. The US can no longer turn around and avoid financial Armageddon. As I've previously stated, the US and the world can only print money to meet existing debts and future obligations. The US Dollar will eventually collapse and be worth its true value – nothing. The same result will happen to the Australian Dollar, the Euro etc. All currencies today are paper money or fiat. It is no longer backed by an asset of value, namely gold. It is backed by our confidence in government. Throughout history all fiat currencies have collapsed.

Interestingly for many, Williams also details that the next US President is highly likely to be a Democrat (Obama) based on a simple economic calculation. "In every Presidential race since 1908, in which constant, real (inflation-adjusted) annual disposable income growth was above 3.3%, the incumbent party holding the White House won every time." Below 3.3% growth, the incumbent party would lost every time. "(today) the current annual growth in real disposable incomes is at 2.2%". ie. a victory for the Democrats.

I will repeat again, regardless of whether it will be Obama or McCain, both candidates will follow the Federal Reserve and print, print, print its ways towards hyperinflation and the US Dollar will eventually collapse. Neither candidate is looking at the root causes of sub-prime, the collapse of the investment banking model, the collapse of the US Dollar. The root cause is Government! It is Government which severed all ties to the linking currency with Gold in 1971. It is Government which created the Federal Reserve in 1913 (a market manipulator). It is Government which has encouraged business and individuals to use Keynesian economics – the system which encourages: inflation, debt and the devaluation of the currency. The world will head to a great depression and remain in a great depression until a leader is elected that recognises these facts! Ron Paul was the only Presidential Candidate this time that understoodd the flaws to the current monetary system, however he was not popular today because the masses want free money thrown at them to fix the system. Printing money will not be sustainble to meet medicare obligations, social security payments etc. You have to keep adding more wood to the fire to keep it going.

The Great Depression will end when currency is linked back to gold (real money).

The world got out of the last Great Depression in 1944 due to the creation of the Bretton Woods system, not because of World War II as most historians recite. After WWII, the world had no workable monetary system. The system had to be re-drawn because the United States had accumulated a bulk of the world’s gold and silver during the war from other countries which took loans from the US. (The US Government had about 6 billion ounces of silver – today it has none!). In a nut shell, the monetary system created at Bretton Woods (in the US) linked currency back to the gold. The US Dollar became the world currency, and would be redeemable to gold at US$35 per/ounce. The system ultimately collapsed in 1971, because France started cashing in its US Dollars for gold. Other countries started to follow, and the US lost over half its post-WWII gold reserves. Bretton Woods was far from a true gold standard; it was a quasi-gold standard and was fundamentally flawed. Gold is finite.

It all comes down to economic accountability. The United States, Australia and the world has been using an economically irresponsible monetary system. Throughout the last century, the strings have gradually been released, moving the system from gold (economic discipline) to all-out "government backed" fiat currency. If an individual does not pay off their credit card, the bank with eventually cut it up in front of you. Central Banks around the world are on the verge of cutting up the US Dollar in front of the US Government, and consequently all world fiat currencies. The fiat system only works because of confidence in government. This confidence will collapse due to the forthcoming hyperinflation great-depression. Paper money won't be worth the paper it is printed on.

Best,
Scott