Monday, November 24, 2008

Measuring the market meltdown so far…

Measuring the market meltdown so far…

It's been a little over year since the All Ordinaries hit its highest point of 6873 on 1 November 2007. On Friday 21 November 2008 it hit a low of 3201 – a fall of 53 percent.

Chart 1 shows the All Ordinaries (the main index for the Australian Sharemarket XAO.ax) in the last 18 months. The earliest and strongest signal that we were entering a bear market was back in January 2008. Since January, the market has tried to find a bottom. After falling, only 2 possible outcomes are possible - i) pause and go sideways ii) Go UP. On each occasion, the XAO paused, then broke support (the green cross), in the search for a new bottom. A bottom has still not been made!

Chart 1: All Ords in last 18 months
As the following chart 2 shows the current financial bear market is rivaling the 1929 crash in speed and depth, so far. With the 1929 crash, heavy losses came straight away, whereas the current bear market had a small correction before it started in August 2007, then a decent crash in Dec-January 2008, then in July-August-September. If we are to follow 1929 from here, there is still some pain to come before the bottom. The current bear market is already worse then the early 1970s (first oil shock) and the Dot Com crash.

Chart 2: Alan Kohler, ABC News 24 Nov 2008
* Note however, that after the initial crash in 1929, from November to January of 1930 the US sharemarket rebounded some 50%, before resuming its major bear market. December-January periods tend to be good months for the sharemarket historically, but not always so (like last Dec-Jan).

Chart 3: in The Financial Review 24 Nov 2008
Chart 3 compares all the bear markets in the 1900s showing the mean percent decline and magnitude (over days). This chart shows that it is comparitable with 1901, 1906, 1919, 1937, and 1973 - but the duration of the current bear market is much much shorter to reach this decline. Only 1929 stands out. Could the ultimate bottom be somewhere near 1929...? and in what time frame?

Comparing the meltdown in terms of Gold and Silver

In the last year the All Ords has gone down some 53 percent measured in terms of Australian Dollars (the stock are measured in $AUD p/share). When you measure the All Ords in terms of gold or silver though(or any other commodity such as wheat, oil or other tangable no-liability (no debt) asset), you will see that the sharemarket has been crashing for several years, going back to the Dot com days. In 1999, 1 point of the Dow Jones could buy you 45 ounces of gold. Today 1 point of the Dow Jones can buy you around 9.5 ounces of gold. In these terms, the Dow has crashed by over 72 percent so far. A similar picture is happening to the housing market in the US (and in Australia), which I will touch on in a future post.

To measure the All Ords, I merely used historical year end gold/silver data (in tons) with year end All Ords data. The charts speak for themselves.

The unique qualities of gold and silver is that it accounts for all the debt and money created throughout time. When sharemarkets, real estate and credit markets bubble, people flock to undervalued gold and silver.

Chart 4: Gold vs All Ords
Notice in the 1970s and early 1980s, gold quickly fell to its overvalued region. Then the sharemarket became undervalued. The All Ords peaked in 1999 (same as Dow Jones) in terms of gold.

Chart 5: Silver vs All Ords
Like gold, silver did the monetary accounting in the 1970s and early 1980s, however today is a very different picture. Silver is extremely out whack and very undervalued compared to gold in Chart 4. The All Ords looks very expensive in terms of silver.

Eventually gold and silver will go back to the expensive levels at the bottom of the charts - but there is some way to go yet!

More good stories to come on gold (and particularly) silver...

Commonwealth Bank now has larger market capitalisation than Citibank

Last Friday, as one market commentator pointed out, with the falling shareprice of Citibank below US$5 per share, the market capitalisation of the Commonwealth Bank (CBA.ax) is now larger then Citibank, once one of the world's largest banks, and still huge in terms of Tier 1 capital and revenue.

Shareholders are now betting the bank will be bailed out by the US Government and that equity holders would be wiped out. As I write this, there are news clips coming out saying the US Government will guarantee close to $US300 billion ($475.3 billion) of Citigroup's assets with an additional an additional $US20 billion in capital to help it stay alive (for now). **insert more fuel to the world economic fire**

Still to come: Housing bubble in Australia, and my thoughts on Obama's Presidential win (in an world economic/monetary viewpoint).

Cheers,
Scott

Friday, November 7, 2008

ABC, Allco, FreightLink collapse

This week we have seen a string of large companies go into administration and further declines in employment across the economy, particularly in manufacturing and resources industries.

ABC Learning

On Thursday 6 November 2008 ABC Learning, Australia's largest childcare provider (1200 centres in Australia and NZ) fell into administration.

The big 4 banks have had huge exposure to ABC:
CBA: $240 million
NAB: $140 million
WBC: $200 million
ANZ: $182 million

The exposure will go much further then the banks. Already toy wholesaler Funtastic said its earnings will likely be adversely affected by the events at ABC.

I believe if the banks are pulling the pin now, they will be more than unlikely willing to throw more money in later after the administration processes run there course.

The overall impact on the Australian taxpayer (the Australian Government) is yet to be played out in full… So far the Government is assuring to keep the childcare centres open for ABC Learning's 16,000 staff and 120,000 children under care until the end of 2008 (at a cost of A$22 million). At the end of day the Government will give way to pressure to provide certainty for the industry over the longer term. ABC's downfall has left a big void in the industry, and who can raise debt and equity in today's market to buy their assets?

Could ABC Learning also be one of the first direct exposures of the financial crisis on everyday life of Australians? Most Australian’s suspect something has been wrong with the world economy, but few are yet to feel it because they might still have their home, their job, their large credit cards and everything else. If the Government didn’t throw $22 million to keep ABC going till Xmas, then 100,000s of Australian families would certainly be in an awkward position with their childcare arrangements. More large business failures in the future will make ABC Learning look like a drop in the ocean in its size and its impact on Australian communities.

A good article on the rise and fall of ABC can be seen:
http://www.businessspectator.com.au/bs.nsf/Article/ABC-Learning-L53L5?OpenDocument&src=sph

Allco Finance Group

On Tuesday 4 November 2008, Allco Finance fel into administration. Like ABC Learning, Allco was in the ASX100 this time last year. Allco was also part of a consortium to takeover Qantas last year, and almost succeeded.

Allco Trusts

The latest reports and rumours are that Allco's listed real estate trusts: Rubicon Japan Trust, Rubicon America Trust and Rubicon Europe Trust Group may also default on their debt facilities, following the collapse of its parent arm. All three trusts are currently in a trading halt.

Other related entities including:Allco HIT, Record Realty, Allco Max Securities and Mortgage Trust and Allco Hybrid Investment Trust are also in trading halts pending possible implications with Allco Finance Group,

FreightLink

This week we also saw FreightLink fall into administration. FreightLink is better know as the railway built connecting Darwin to Adelaide. The company has been for sale for sometime, but has no fallen through. It is said that FreightLink has debts outstanding in excess of $500 million (incurred to fund the construction of the railway). The project received both State and Commonwealth Government funding to get off the ground.

There will be a lot more to follow

How long before the banks pull the pin is pulled on Centro Properties and Babcock and Brown…? There will be many, many more to come in the next couple of years. I really think one to watch for in a years time is Wesfarmers, who bought Coles Group at the top of the market and geared it full of debt. If it did go into trouble, who could complain if Coles group was broken up? We really do need greater competition in food retailing in Australia.

Be werey of Property Companies

Other companies at risk is anything to do with propery. Currently in the ASX100 there is about 10 listed property trusts (known as REITS). Centro has already left the index, and probably had the largest amount of short-term debt on its books. Valad Property (again entered ASX100 about 6 months ago) is in a lot of trouble. There will be many more to follow as the property market (commercial, residential, industrials everything) in Australia starts to fall heavily within the next 12 months.

Put GM and Ford into Administration already

Meanwhile in the United State, the US Government just can’t come to terms with the financial health of General Motors and Ford. They should have been allowed to fail a couple of years ago. Instead they are burning cash, and essentially running while insolvent. Their only life line is the US Government, which gave the US auto industry around US$24 billion in the week leading up to the US$700 bn bail out. Apparently they are now burning US$1 billion per week! No company can do this for too long.

~ Scott

Tuesday, November 4, 2008

Australia splurges on Melbourne Cup all the while...

Melbourne Cup & Interest Rate Cut

First Tuesday of Novemeber each year is Melbourne Cup - the race that stops the nation.

Only 30 mins before the race begun, the Reserve Bank of Australia (RBA) cut the official interest rate by 75 basis points to 5.25%. This follows a string of bad news starting to filter out about the fragility of the Australia economy. Despite all signs pointing to a economic recession ahead for Australia, we managed to spend over A$100 million on the Melbourne Cup day, a record amount. The winner of the cup was Viewed - at odds of 41 to 1 - Perhaps the same odds of Australia and the world going through a mild world recession.

It was Only a couple of weeks ago the Australia Government announced a $10.4 billion economic stimulus package, and in doing so, halved the avaliable surplus. Could it be that Australia spent a lot of its stimulus package on the gallops today... and whats left over will help pay for Xmas pressies. Afterall, the Government wanted to stimulate the economy. Perhaps they have helped filled the pockets of the bookies instead, and we all know that will somehow help GDP and employment figures...

Bad news Monday (3rd Nov)

Performance of Manufacturing Index (PMI)

The AiG Performance of Manufacturing Index was released yesterday which showed the worst result for manufacturing in Australia for 16 years (since the PMI started in 1992).

Summary:
- this month’s result reflects a combination of the uncertainties and loss of confidence associated with the worsening of the global financial crisis, slower world growth, particularly in the developed economies, and weaker domestic consumer demand.
- These factors were reflected in declines across all components of the Australian PMI® in October. Production fell for the fifth consecutive month and more strongly than in recent months. This reflected the ongoing decline in new orders, which fell for the sixth consecutive month. In line with the easing of production, employment fell for the eighth month in October and at a more rapid pace.
- On the positive side, input and wages costs growth eased significantly in October, while selling price growth also eased solidly.
- Inventories and supplier deliveries fell markedly. Exports fell.
- Manufacturing activity fell in all states.

Housing prices suffer record quarterly fall

Also yesterday the Australian Bureau of Statistics (ABS) released housing activity for the September 2008 quarter.

Last (Sept) Quarter:

- House prices fell by 3.3 per cent in Brisbane, 2.5 per cent in Canberra, 1.9 per cent in Melbourne, 1.8 per cent in Sydney, 1.1 per cent in Perth and 0.1 per cent in Adelaide.
- House prices rose by 0.7 per cent in Hobart and 0.1 per cent in Darwin.

For the 12 months till end of September 2008:

- Perth recorded the biggest annual fall in house prices of any capital city in the year to the September quarter, down 4.1 per cent compared with a 2.8 per cent increase nationally.
- Brisbane's 12 month growth is 5.6 per cent.
- Adelaide has the strongest housing market, growing at 9.7 per cent over the year.
- Melbourne grew by 8.1 per cent over the last year.

So the longer term growth numbers still look rosey and distort the falls over the last 3 months. If the Sept Qtrly figures continue, we could see falls in housing prices across Ausrtralia of 10-15 per cent (mininium) by this time next year.

My next post will go into more detail about the outlook for housing in Australia and why debt levels are of a huge concern...

Cheers,
Scott

(Lets hope my gloomy economic predictions are wrong like my Melbourne Cup picks - Zipping and Mad Rush)

Friday, October 31, 2008

Global Trade at Risk

The following is an article today from Alan Kohler. He and a few other commentators were talking about this issue a couple of weeks ago. It appears to have worsen significantly, and yet it doesn't even pop up on the nightly news or the front of main stream newspapers.

Kohler's articles can be viewed daily at: http://www.businessspectator.com.au


The global shipping crash continues to get worse and this morning’s GDP data shows the US recession is already deeper than 2001 and probably 1990-91 as well.

Meanwhile the International Monetary Fund seems determined to make the whole thing worse by imposing the most ruinous strictures on supplicant nations.

Yesterday the Baltic Dry freight rate index fell below 1000 for the first time in six years and last night it fell another 40 points to 885. In June the index was 11,900, so it has fallen 93 per cent in a few months – a crash far worse than anything ever seen in the stockmarket.

The spot daily rental for a Capesize ship is now $6365, down from $234,000 per day over the space of a few weeks. Maybe that previous price was absurdly inflated, but at $6365 it is just $365 above the average daily cost of crews and fuel.

As a result the world’s ports are filling with empty ships because shipowners can’t afford to run them, as well as some full ships because the owners of the cargo won’t unload without a bank letter of credit, which banks are refusing to supply.

Shipping companies are starting to file for bankruptcy in increasing numbers as they breach loan covenants, and a shipping researcher, Andreas Vergottis of Tufton Oceanic has told Bloomberg that a fifth of the world’s dry bulk companies may soon have negative net worth because the market for second hand ships has collapsed and the value of their fleets is below outstanding debt.

Like property-based loan agreements, shipping companies’ debt covenants have loan to value ratios that are typically 70 per cent. As the value of their fleets decline, banks are making margin calls.

Meanwhile, as expected, US GDP fell in the September quarter – by 0.3 per cent. The only reason it wasn’t worse was government spending, which added 1.1 per cent to the rate of GDP change. There was another 0.6 per cent from private inventories – that is, unsold goods.

In any case, US economic data is always rushed out quickly, based on guesswork, and then revised later. Most of the guesses in this morning’s figure look optimistic, so it is very likely to be revised downwards.

Even on this morning’s optimistic estimate, it is the first year-on-year decline in GDP since 1991, so this recession is already worse than 2001 and clearly has a long way to go.

And remember that in 1990-91 – and 1980 and 1973 and 1961 for that matter – the monetary and fiscal authorities were more or less in control. Or rather – they started it.

Those recessions were caused by central bank and government efforts to control inflation. This time it’s all about a spontaneous collapse in private sector credit and governments around the world are desperately trying to counteract its effects with interest rate cuts, liquidity injections and fiscal stimulus.

That is…all except the IMF. It is imposing the most horrendous conditions on bailout loans to bankrupt countries.

As the rest of the world’s official interest rates come down, Iceland’s this week went up 6 per cent, from 12 to 18 per cent, as a condition of its $US2 billion rescue package.

Hungary, Serbia, Belarus, Pakistan and Ukraine are now facing the most excruciating choice: default on their debts or ask the IMF for money at the expense of crushing their economies under the weight of a massive increase in interest rates.

As Ambrose Evans-Pritchard writes in last night's London Telegraph: “A deflationary strategy of this kind could prove counterproductive – or worse – if applied in enough countries simultaneously. It would defeat a key purpose of the rescues, which is to stabilise the global financial system.”

Meanwhile China, the world’s greatest creditor nation, is now cutting interest rates as its economy slows.

The emerging world in general has “recoupled” (if it was ever decoupled) and the removal of hedge fund investments in their currencies, government debt and sharemarkets will, in many cases, result in deeper recessions in those countries that in the US – where it all started.

Which is why global shipping has collapsed
: it is the harbinger of the end of the era of trade, in which third-world labour costs kept first world inflation down and allowed interest rates to fall and stay low and debt to be increased to an historic degree.

That process of importing deflation (or, more precisely, disinflation) from developing nations – especially China and India – relied on trade: raw materials in; finished goods out.

The fall in freight rates for both dry bulk carriers and container ships is telling us that it’s over.


Australia is potentially in the most vulnerable position. Commodities could potentially be on the brink of collapse if ships do not start to move soon. Already we are currently witnessing Mount Gibson Iron (MGX.ax) in a trading suspension because China will not/cannot move its ships to buy MGX's iron ore. MGX is by no means a small Australian company. It is in the ASX100, and would be in the top 20 resource companies in Australia.

The fallout of a huge resources bust is almost unthinkable. A few zinc mines have shut (or reduced output) over the last few months in Australia. Now at current spot prices, even OZ Minerals Century Mine (formally Zinifex) near Mt Isa, the 2nd largest zinc mine in the world, is unprofitable at current prices. Commodity prices need to rebound quickly along with ship movements, or Australia will enter deep recession within a year. Commodities make up around 60% of Australia's exports, and it is no coincidence that the Australian Dollar has fallen by 40% in only a couple of months!

Picture this: A truck driver working in a mine in the Pilbara earning over A$100,000 p.a. suddenly looses his job because the mine shuts down. Only a year earlier he took out a mortgage on a new house in Perth. However, 100,000s of other people are in the same situation. Mines closing, exports decreasing. Australia hits recession and there are few jobs. The miner, who expected to maintain employment and a high income is suddenly unable to pay the monthly mortgage with no solid income. Property prices across Australia then start falling sharply on weak buyer demand and falling expectations.

This is a real possible situation which may hit Australia soon if the resources boom comes to a grinding halt which is increasingly looking more likely.

Scott

Tuesday, October 28, 2008

The free market has failed!?

The free market has failed!

There has also been talk recent in the media that the free market has failed and that the world political spectrum is shifting to the left. Unfortunately the journalist's writing these articles do not define what a free market is. Today's monetary system is far from a free market. Most markets have increasingly become more and more manipulated over the decades.

A free market has no role for big government, or mass market manipulation (by central banks, Governments and other market participants such as hedge funds and speculators). Why does Europe, the US and other parts of the world pay its farmers not to grow crops or pay their farmers for being grossly inefficient? Why are a couple of US banks allowed to manipulate one third of the silver spot market currently? Why have government's all around the world taken over more and more areas of responsibilities over the last one hundred years? No one living today has ever lived in a free market. The media, who fails to define what a free market is, has skewed the meaning of a free market. Instead we are hand fed to and told "the free market has failed". Government's have failed in maintaining their manipulation of the markets, and now they are refocusing attention back on big business so as to create a mandate for further Government intervention.

Go back in time before the 1900s. There was little inflation. There was little Government intervention in economies. Nation building still occurred. Railroads were built across America and Europe which provided, arguably the biggest technology productivity gains to human kind (the economic efficiencies from horse to rail was very significant). There was still a need for doctors, nurses and teachers. The US built an economic empire and became a world power long before the Government introduced income tax.

Today, Governments are getting larger and larger. The more people working in Government (and indirect jobs of Government), the less productive a nation becomes. There is a limited role for Governmentto provide some boundaries in certain markets, or to provide goods which the market will not provide. Boundaries are important, but too much regulation disrupts free market flows.

By in large though, big government creates more inefficiencies. We pay more for roads, health and everything. Nothing can compare to an efficient private sector firm, assuming the firm operates in a competitive market place. People want the Government to provide bigger and better systems for health, education, security etc. There is an economic cost and consequence for all social desires. Almost daily we hear X amount of beds are closed in the hospital system. It's desirable to have beds for everyone, but the cost of keeping a bed open requires staff, equipment, and maintenance. Hence, it all comes down to economics. Limited money means limited hospital services.

There is less individual responsibility in the economy today. The more individual freedoms we give to Government the greater the economic cost (and ultimately social cost) for individuals. We pay more taxes then ever, and yet out health and education systems aren't improving.

The problem is Government, not the free market

The free market has incorrectly been criticised and labelled by Governments and the media as the root cause to today's financial problems. Today's monetary system is a mess because of Keynesian economics. A Keynesian monetary system is a sloppy system that distorts free market principles. It's a system which encourages individuals and governments to use unaccountable money by increasing debt and consumption, and eroding purchasing power through inflation. The monetary system needs to revert back to honest money – money backed by a finite resource (gold and silver), not a printing press. If a ship sinks in Sydney harbour carrying gold and Australia Dollars – which would a scuba diver go after?

Now is not the time for the world to turn left on the political spectrum and allow Governments to discourage entrepreneurship and individualism. Turning left will encourage more dishonest money from the government’s printing press, encourage banks to be even more reckless. Banks and companies which should be left to die, will hang onto overpriced assets so they can sell them back to Governments, rather then back to the marketplace. Companies do not go completely bankrupt. Bad assets are sold to the nearest buyer, whether its 5c or 10c in the dollar. But Government’s will probably pay 40c or 80c in the dollar for the same assets. If the US Government (and elsewhere) buys back too many mortgages and other bad assets, it will only create greater deflationary pressures (the economy needs debt and increasing levels of debt and consumption for it to function properly in the current monetary system).

All we are going to see in the coming years is more promises from Government, promises backed by a printing press. Promises based on manipultating markets (through Central Banks and the Treasury). Now the promises will be more socialist and protectionist. Government nationalisation of banks and financial instititutions and protectionist policies for manufacturing and agriculture (in particular) will onyl distort free trade and create further inequity.

The Government has no mandate to increase its intervention and manipulation in the non-existent free market we currently have.

How many years will it take for the world leaders to wake up and redesign the world monetary system away from Keynesian and revert back towards the Austrian School? (The economic thought that advocates adherence to strict methodological individualism). I believe it will be many, many years before there will be any substantial progress to significantly change the world monetary system. After all, Government's are addicted to the printing press, and dishonest money. Government's want to make sexy-billion dollar promises to their constituents. Pollies find it hard to keep to their promises now, let alone what they would under a more honest monetary system.

We do not operate in a free market and the free market has not failed!

Tuesday, October 14, 2008

Boiling Frog Syndrome

Boiling Frog Syndrome

Ted Butler of www.investmentrarities.com summed the current situation up best.

People do not appreciate the current economic events, because every day there is more and more bad news. We start to tune out of it after a couple of banks go under. It starts to feel normal (or common). People also just do not like to hear bad news. It's a bit like hearing terrible war stories from Iraq or Afghanistan. We do no truly appreciate the true seriousness of events over time, only if it personally affects us.

If you put a frog into a pot of cold water and increase the heat gradually to a boil, he won’t jump out.

The heat is on the world economy and now is the time to wake up. Don't wait for the water to reach boiling point. Major banks and insurance companies which go back to the mid 1800s do not suddenly go bankrupt for no good reason.

(Ted's boiling frog explanation was originally in relation to a retail shortage in the silver market. I have yet to find time to discuss the opportunity in silver on my blog, but right now there is a 10 week wait to take delivery of any silver in Australia. There is a worldwide shortage, yet the price of silver is still low because of market manipulation by a couple of US Banks. More to come on this subject..)

To avoid the boiling frog syndrome you must have i) an open mind, ii) change your context and iii) take action.


Last week in Review:

U.K. Trillion Dollar Bailout


Last Wednesday 8 October 2008, the UK government announced a £400bn bank rescue package to help increase bank capital and sure up loan guarantees.

The chart below puts some perspective on the bailout plan:

Six central banks cut rates

Also on Wednesday, six central banks cut interest rates by half a percentage point (following Australia 1.0 percentage cut on Tuesday). The US official interest rates are now 1.5%, and the European Central Bank (ECB) has its rate at 3.75%.

"Free-Fall" Friday

Sharemarkets continued to fall dramatically last week, with many stock exchanging closing at one point due to indexes falling by over 10% (Indonesia and Japan). The worst falls by far came on Friday.

- Australian ASX down 8.2% (down 16.2% for the week!)
- Japan's NIKKEI down 9.62%
- UK FTSE down 8.85%
- German DAX down 7%
- US Dow Jones down almost 10% at start of trade, but ended up closing 1.5% lower.

The Australian Sharemarket has now fallen 42.5 percent since its peak on 1 November 2007 in about 243 days. This bear market is officially worse then most previous bear markets.

Prime Minister Rudd Guarantees bank Deposits

Political pressure came to be, with the Australian Prime Minister would guarantee all bank deposits in Australia for the next 3 years. This is estimated to cover about A$700 billion. The government also doubled to $8 billion the funds available to improve liquidity in residential mortgage-backed securities.


Main discussion point today: Shake up for world Industries

Automotive

The US car industry, in particular, has been in dire straits for a number of years. The only reason General Motors (GM) and Ford have not gone into insolvency is because the US Congress keeps throwing tens of billions of dollars at them. A couple of weeks ago $24 billion was thrown.

The US Government is not prepared to see GM and Ford collapse. They are bigger then many countries in terms of annual revenue and employment.

Ford currently has a market cap of US$4.55 billion. Ford lost US$12.6 billion in 2006, and US$2.7 billion in 2007. In the 2nd Qtr 2008 it lost $8.7 billion! (in only 3 months).

GMs share price is now at the levels of 1956, with a market capitalisation of US$2.77 billion. GM lost US$38.7 billion in 2007, and US$15.5 billion in the 2nd Qtr 2008! (in only 3 months).

Companies which are loosing tens of billions of dollars every year should not be kept in business. New car sales in the United States are now at their lowest level in 15 years. The US Government and taxpayers have always subsidised the auto industry, but the cost of doing so today is for its very survival. If they were allowed to fail, many hundreds of thousands of workers would loose their jobs world wide (think of component manufacturers and indirect jobs). I suspect the main reason for keeping GM and Ford alive is all about confidence. In the early 1930s, Ford laid off 10,000s of workers, which helped fuel further unease in the outlook for US economy.

They represent manufacturing and economic activity. With millions of American's foreclosing on their homes over the last few years, no one is looking for a new car. People go back to basics and if the 2nd hand car works, why replace it?

Talk on the street is that Ford and GM proposed a merger recently. Current talk is GM is now exploring a merger with Chrysler and Ford is apparently seeking to offload its majority stake in Mazda.

Where ever this goes next, one thing is almost certain and that is consolidation in the automotive sector. There has been too much competition. The car manufacturers have been absorbing rising steel prices, aluminium prices, wage prices etc. As a consequence, they have been unable to pass these costs onto the consumer in full and their profit margins are squeezed. So they have been left caught building increasingly expensive cars, that no one is prepared to buy.

Consolidation across other industries


There will be more consolidation across all other areas of industry. The longer the credit squeeze goes on, the more depsrite companies will be to merge with one another, or face bankruptcy. Right now it is basically impossible for companies to raise equity, to raise debt, or even sell assets to raise cash.

Airlines

The best example of consolidation will be in the Airline industry. We are all familiar with the $1 special sale fare's JetStar and Tiger Airways etc has every few months. Competition is fierce, yet airlines are operating in an environment where fuel has been hurting growth and profits. Air Italia is going under. The low-cost carrier model isn't sustainable. Only the major airlines which consolidate will survive a major global downturn. Many have gone under in the last few years, and this happened in economic good times.

Commodities:

As discussed previously, commodities have had a rough time in the last couple of weeks. Deflation is hitting both hard commodities (metals and energy) and soft commodities (agriculture).

Hard Commodities

In Australia, we should particularly see consolidation in the resources sector. Many high-cost producers and explorers will go out of business. Companies will need to preserve capital, which means less exploration. Those who have plans to start producing 3 or 5 years down the road will find it difficult to get into production. The best near development assets will have to team up (joint ventures) with cashed-up majors or sell equity to overseas investors to get their project into first production. Only the very low cost producers will manage to bring in sustainable cashflows to keep their business going.

Right now the market is factoring in that many resource companies will fail. However, some of the better companies are falling just as hard as the bad ones. Several companies I have come across have a market capitalisation less then the cash they have in the bank (AED, BRM and CFE for example). Maybe the market is factoring in that the Australian Dollar will be worth less in the future :) ?

It was only less than 10 years ago, that many large resource companies went insolvent and closed down their mines. Zinifex (now OZ Minerals) is essentially a repackaged Pasminco. Ironically now that zinc and lead prices are becoming low again, and many mines are being closed and placed on care and maintenance.

Commodities work on boom and bust. This sector works on over confidence or no confidence. You don't want to be holding a commodity stock during a bust. Right now the market is factoring in that the US led global slow down will severely affect demand coming out of China.

Soft Commodities

Soft commodities should fare much better then hard commodities in times of economic depression. Our spending habits change from buying luxury goods (new cars, plasma's etc) to the very basics. At the end of the day people still need to eat, and if it takes 100% of our disposable income to buy food, people will do it (which is exactly what has been happening already in some countries).

However, the global liquidity freeze will affect farmer's world wide. Banks will be less willing to lend debt to farmers for a wide variety of reasons. Many farmers are already in heavy debt, and have less capacity to repay debt in the future. There is always the uncertainty of drought, flood and other forms of crop failure. Farmers have also been absorbing a large slice of the inflation pie in recent years. Rising fertiliser and fuel costs have not been offset by rising food prices. Farmers are still price takers, with many receiving the same prices for potatoes or milk then what they did 10 years ago. They know exactly what inflation is (on costs of production), and they know exactly what deflation is (the price they receive). On top of this, the 2 major supermarkets in Australia are squeezing the farmers (and food manufacturers) out of the market because of their market power. Lastly, rural Australia is already being hit hard by an aging population. There are not enough young people coming through to replace those looking for retirement in the next 10 years. All this factors will mean there will be fewer farmers, less domestically grown food, higher prices, and more food imports to Australia. Couple this with international factors, such as a population the size of Australia moving from rural to urban landscapes in China each year, and a major push for biofuels, and its easy to comprehend that food prices world wide will inflate dramatically in the coming decade.

Investing in a backyard vegie garden might become widely popular again, or be prepared to pay a greater amount of your disposable income on the basics.


The next post will be on Household Debt and why Australia may end up in a worse situation than the US within the next couple of years.

- Scott

Wednesday, October 8, 2008

RBA cuts official interest rates by 1 percent

Interest Rates cut by 1 per cent

Today the RBA cut the official cash rate by one hundred basis points, from 7% to 6%. This moved stunned the local market, which was expecting half a point cut. This is the largest cut in rates since May 1992.

I think this move by the RBA highlight their concern for the global economy and the recent events in the United States and Europe. They know confidence in Australia could quickly erode and the global liquidity crisis will likely get far worse, and spread to more countries. Australian interest rates are clearly too high in the current environment and today's move is very assertive.

Australian Dollar

A couple of months ago the media was talking up parity with the US Dollar. As I write its fallen to around US$67c. This is a huge fall in such a short space of time.

The main reason why the Australian Dollar is falling heavily is two fold:

a) The US Dollar is has been appreciating due the illiquidity in the world money markets. US money supply growth has been contracting fast. People are expecting property prices, share prices etc. to fall, and are holding off getting new loans. There is now less US dollars chasing assets.
b) Commodity prices, in particular, have fallen sharply in recent weeks due to expected lower global demand (in China and elsewhere) for commodities, and due to less money floating around (liquidity). Zinc and nickel have been in long-term trends, but now the rest are following suit. Australia is heavily reliant on commodities for its export income, and further expectations of falling prices is driving the Australian Dollar lower.

One benefit of the Australia dollar falling is that Australian should now spend a lot less on imports. We have been binging on the commodities boom and the high Aussie dollar. Our wallet will not go as far this Christmas.

Fat Cats and the $700 bn bailout

Last week in summary

United States:

- Last week, we saw the Dow Jones fall over 7% on Monday 30 September on news the US$700 billion bailout bill had not passed the lower house of congress.

- Wednesday, a revised US$700 billionn bailout bill passes the upper house of Congress (Senate).

- Saturday (Aust time), the US bailout bill passes the lower house of congress. The reception to the bailout was not joy and elation. The Dow Jones ended up loosing 7.3% last week and the Nasdaq 10.8%, the worst week for the sharemarkets since 9/11.

Other countries:

- Germany's Hypo Real Estate Bank received a €35 billion (US$51.2 billion) bailout, Germany's No. 2 commercial property lender, and first German bluechip company to be rocked by the global credit crisis.

- Iceland in trouble (see below).

- Commodities (soft and hard) fell over 9% last week, the largest drop since at least 1956.

This world is currently experiencing: deflation.


US$700 billion bail out


The bail out plan was largely smoke and mirrors driven by election year politics.

The Federal Reserve has injected hundreds of billions of dollars into the system – which did not require congress approval. Henry Paulson, the US Treasury secretary is a former CEO of Goldman Sachs. There was no doubt he talked up the seriousness of the situation to President and congress to help his former banking colleagues. Warren Buffets US$5 billion investment (bet) into Goldman would have largely been on the expectation that Paulson would get his way. No doubt Buffet would have factored this in when looking at Goldman's fundamentals. However, a bail out is a bandaid and offers no long-term solution. The bankers will be back later to ask for more money.

Fat Cats

In the days leading up to the bail out plan passing congress, the world media was harpy on about the "fat cats" on Wall St. This commentary had good reasoning, with investment bankers, in particular, enjoying overly lavish salaries and bonuses in the last decade by simple marrying over priced assets (such roads, ports, power stations etc) with debt, and skimming nice profits off the top through management fees. The current liquidity/debt crisis shows that these assets are now grossly overvalued, because debt has become expensive, and even equity raising is becoming difficult.

Government


However, the global credit crisis is not just the fault of the fat cats. If there is any entity to finger point – its Government. It is Government which has encouraged business and individuals to use Keynesian economics. The economic structure which encourages devaluation of the currency, inflation and debt. The root causes, in particular, goes back to 1913 (when Federal Reserve was created) and 1971 (when bretton woods monetary system broke down). The Federal Reserve is nothing short of a market manipulator. It encourages people to spend more when they shouldn't! When looking for the root cause of sub-prime or the current credit crisis, most media commentators only look back about 10 years, to when the Clinton Administration encouraged Fannie Mae to ease credit requirements on loans to low-income earners. Others finger point Alan Greenspan who pumped the US economy with cheap credit by lowering interest rates. Both these instances are true, but no one is looking at the structure of the monetary system itself. Today's monetary system is no longer accountable without a link to gold.

Individuals

It's not just Government which is at fault. It's also individuals. Individuals who signed the dotted line for sub-prime mortgages, are as much to blame then the fat cats on Wall Street. At the end of the day, there needs to be individual responsibility for investment decisions. When there is a crisis, people always need someone to blame, a scapegoat. If people max out on their credit card, the bank with cut it up in front of you. Money has to be accountable. Individuals have to be accountable for their decisions. Unfortunately, individuals are once again, collectively looking to Government to resolve the global credit crisis through increased regulation. This will be detrimental to the free market which would clean out the bad money by itself, but now the US Government is leading the charge by throwing more bad money into the system through the bail out plan, and through the Federal Reserve injecting money into the system. The RBA is doing the same in Australia.

Why sell for pennies, when the Government will pay in dollars

Some commentators argue that the reason the market is so illiquid at the moment (with many banks going under or merging) is because they are holding onto bad assets which they should be selling to the market for 20c or 30c in the dollar. But because they have been expecting government to bail them out and buy the bad assets, they could sell these bad assets for 50c or 80c in the dollar to the US Government. Banks and companies do not go completely bankrupt. Left over assets are sold to the nearest buyer. This is how Macquarie has built a lot of its empire, by buying badly managed assets and better manage them.

$700 Billion vs. $600 billion

Lastly, the irony of the now failed $700 billion bail out is that the US Senate last week passed a $600 billion "stop gap" package including: $25 billion loan to the auto industry (for General Motors and Ford), $24 billion fro disaster relief for the recent Hurricanes... and other things such as ending the ban on oil drilling off the Atlantic and Pacific coasts. Really what's the big difference between lots of spending items that add up to $600 billion one week, and the $700 billionn bailout package the next?

Iceland?

In the last couple of days, Iceland's Prime Minister has warned that their country was threatened with national bankruptcy due to the global credit crisis. Aparently, Iceland's banks went on a debt binge, much like the investment banks in the United States. It's banking assets soared to nine times the annual GDP of Iceland. Now the repercussions: a collapsing currency and soaring inflation. With the banks on the verge of collapse, the Icelandic Government would be unable to bail them out, effectively bankrupting the nation. The Government did however provide an unlimited guarantee of bank deposits held by individuals. But covering this will be very inflationary.

It may be worrying to see a small country on its knees, but this is just the start. As I keep alluding to, the United States will fall on its knees too… its just a matter of timing. Like Bear Sterns going under, or AIG, or WaMu – Iceland should be seen as a wake up call to other countries that they could be next.

Is your money safe in the bank?

Is your money safe in the bank?

This may come as a surprise to most Australians.

Australia remains one of only two OECD countries, the other being New Zealand, that does not provide an explicit government guarantee for bank deposits. (page 16, The Australian Financial Review, 3 October 2008). If a bank goes under, your deposits, the Government hasn't promised it will secure your savings.

This is good and bad.

As I explained last week, the United States setup the Federal Deposit Insurance Corporation (FDIC) in the last Great Depression. It protects the first $100,000 of deposits an individual has in a bank. Last week, they (temporarily) raised the amount to $250,000. I guess this is to try and provide further confidence to the US citizen.

Earlier last week when Ireland surprised the world by issuing a Government guarantee for all bank deposits in its six largest banks, with no limit on amount covered. Most of Europe followed, with Demark, Germany, Australia, Sweden and Iceland following suit with an unlimited guarantee of bank deposits.

As I explained, if a large scale bank run occurred, FDIC or central banks around the world, would not be able to meet their obligations. The only way it would be able to, would be to fire up the printing press which would be extremely inflationary. People would get their savings back, but their purchasing power would erode significantly. So having a government guarantee isn't necessarily a good thing. There is no point guaranteeing savings, if a) it helps create hyperinflation b) people hoard money because they don't have confidence in the banks or government.

On the up side, with no government guarantee for savings in Australia, our banks have arguably been less reckless then what they could have been otherwise. Nonetheless, the situation in the US will ultimately come back to hurt Australia and the rest of the world regardless of how prudent our banks may have been in the past. FDIC has already paid billions this year to meet some small bank runs (IndyMac bank).

There is now talk, Treasurer Swan will fast track legislation to introduce a financial claims scheme, similar to FDIC, in Australia. It's all about maintaining consumer confidence - confidence in government and confidence in our monetary system.

Wednesday, October 1, 2008

Can't see the forest from the trees

Can't see the forest from the trees

In Australia today, we are being reassured by the Australian Government that "Australia is different", that we can "weather the financial storm in the United States". This can't be further from the truth. The economic/financial systems in Australia are essentially identical to the economic/financial systems in the US, Europe and around the world. The immediate fallout from the US, so far, is in our sharemarket, and consequently, in our retirement savings (superannuation).

There are differences in regulations between countries, but regulations cannot prevent the market from what it wants to do. If the sharemarket wants to plummet. It will plummet. Central banks and governments try to influence and manipulate markets, and they fail time and time again. They try to put a bandaid on problems such as the sub-prime crisis, without looking at the root causes. Governments are essentially powerless to the market forces. You cannot change the direction of the tide.

Is the Australian economy strong today?

- Our unemployment rate is 4.1% (seasonally adjusted)
- We have 10.7 million workers and 457,000 unemployed;
- "Official" CPI inflation rate is 4.5% (year end to 30 June 2008);
- Exports are growing strong, but so are imports; and the
- Australian Dollar has been strong compared to most currencies in recent years.

These numbers still sound great, except inflation has gone well over the 2-3% RBA target band. Australia now has very low unemployment, and retail spending is still buoyant. Export values are climbing fast. Today, we feel more distant from the problems in the US. We cannot see the forest from the trees because the current good times have been going strong since the early 1990s. Look at the big picture!

We cannot ignore what is happening in the US. It will affect us in a huge way… it’s a matter of timing. Wait for when the unemployment rate will turn around and head towards 7-10% again. Inflation is already on the rise. With high inflation and more people unemployment, foreclosures in Western Sydney and Melbourne will become more frequent. The wheels will start to fall off.

Is the economic data reliable?

As I have stated previously, politicians, scientists, journalists or whoever can bend facts to make their argument look better then another person's argument. One scientist can use one set of data to try to prove climate change is man made, while another scientist could use a longer data set to prove climate change is a natural, cyclical process. It's the same with inflation and unemployment data. Numbers are based on methodology and reliability.

Measuring Inflation

Lets look at inflation. Is it really 4.5% in Australia today? It might be if you have full confidence in government.

Inflation in Australia is measured through a the Consumer Price Index (CPI). It measures quarterly changes in the price of a "basket of goods and services". Items consumed by the CPI population group (capital cities) include things such as: food, health, housing, household contents, alcohol, clothing, and transportation. Common items such as milk, bread, cars, petrol are collected monthly as they can be quite volatile in price.

Your spending habits may be completely different to what's in the basket. A family renting, with 3 kids under five years, spending $20 a week on milk will have different spending habits to a retired couple who has no mortgage, and is travelling around Australia (for this couple price inflation for food and fuel will vary greatly around the country). I believe CPI does not represent the true cost of inflation. Ask farmers what the price inflation of fertiliser has been in the last 12 months, or ask manufacturers who are buying steel. A lot of the inflation in the economy has been in input prices (fuel, commodity prices, wages etc.), not output prices (what end users will pay).

At its most basic level, I previously mentioned that Australia's money supply expanded by 23% in the year to end June 2008. This tells us there is a lot of inflation coming to Australia very soon. In this year alone the 23% extra money in the pool has to "find a home". It will compete with existing money to push up rent prices, food prices, property prices etc. Real inflation is much worse then the CPI is telling us.

In Australia, the CPI method was first introduced in 1960. Since this time the CPI has been reviewed and reweighed 13 times – generally every 5 years. In 1998 for instance, several major changes were made to the index. That is, CPI changed from measuring living costs of employee households to a general measure of price inflation for the household sector as whole. Changing the methodology, and changing what's in the basket and outside the basket, changes the outcome. The same happens with measuring unemployment rates. Changing the defition, changes the published unemployment rate. We cannot easily compare apples today to apples fifty years ago, because the apples today have been diluted.

CPI is just like what happens on the sharemarket. Standard's and Poor's (S&P) review and reweigh their share index's four times a year. Take the ASX top 100 stocks. If a stock has performed badly it is removed from the index and replaced by a better performing stock. For instance, Centro Properties was removed recently because its share price has fallen 91% in the last 18 months. By removing the bad companies (or items) out of the index, you can make the index look better over time then what it would be otherwise.

What we must do instead is measure items in terms of our purchasing power. Today, a lot more households have two breadwinners to try and pay off the mortgage and to meet expanding debt liabilities. A few decades ago, most households had one breadwinner to pay the mortgage and everything else. Back then there were no computers or plasma's, but people still bought houses, cars and food. Are we really any more prosperous today? Cars and restaurants might be fancier today, but they still serve the same purpose.

Inflation in the United States

Like Australia, the US has constantly reviewed and reweighed how it measures inflation. The following charts shows this quite clearly.

Chart 1: Real Money Supply Growth in the US
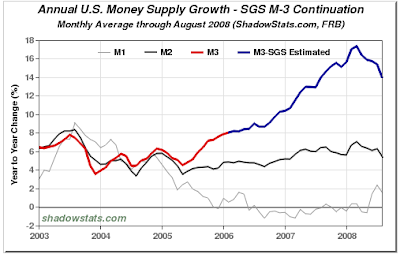
According to shadowstats.com,m3 money supply growth in the US grew by 17% in 2007. Remember from my previous post, the US stopped publishing M3 money supply in March 2006. This is the fastest rate of money supply growth the US has seen ever. This new money (including the $700bn if approved by Congress) has to find a home in prices somewhere...

Chart 2: Real Inflation in the US
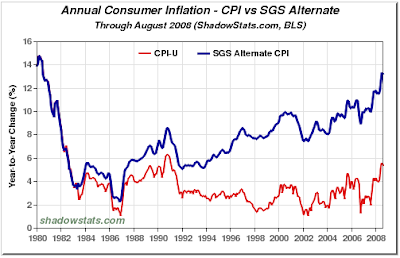
According to shadowstats.com, if the US did not keep diluting its CPI measures, real inflation in the United States today would be around 14% per annum (blue line), vs what the government tells us (red line).

Chart 3:
CPI today compared to pre-Clinton administration.
So the pre-clinton CPI would be about half-way between the red and blue lines in Chart 2. Obviously Government is keen to dilute the facts more and more often (as the news gets worse).

Extreme Price Movements

There are 2 main types of extreme price movements and economy can experience.

1) Deflation

Deflation is the opposite to inflation. It is when there is a contraction in money supply (a decrease in prices of goods and services). Money is becomes illiquid and does not flow.

2) Hyperinflation

Hyperinflation is extreme inflation of prices. It is when prices are increasing by 1000% or more per annum. Think of what's happening in Zimbabwe today. It's money supply is currently doubling in price every 28 days. So if your home is worth $5 million today, it will be worth $10 million in a month's time. You will not be any more wealthy, just the opposite. Purchasing power erodes rapidly during hyperinflation. Wage increases wouldn't be negotiated yearly; they would be negotiated fortnightly or weekly under hyperinflation – just to keep pass with increases in the cost of living.

Old and new words

For the last few decades the media has largely used terms such as inflation and recession. ie. mild hike in prices, and mild economic downturns. These words will be replaced in coming years by hyperinflation and depression. We are heading for "extreme" inflation and a "great" depression (GD2?). Governments, the media, and the people will have to change their context and get with the times...

The next Great Depression will be characterised by hyperinflation

The last Great Depression of the 1930s was a deflationary one, characterised by prices collapsing. The next Great Depression will likely be more along the lines of what is happening in Zimbabwe today, or in Weimer Germany in the early 1920s. The 1930s Great Depression was deflationary because the gold standard invoked monetary discipline, whereas today, the limitless printing of money will create hyper-inflationary pressures on prices. Both deflation and hyperinflation cripple purchasing power, employment and the normal functions of an economy.

For some great to-the-point commentary on the current economic environment in the US and where we are heading, I strongly recommend reading John Williams (of Shadowstats.com) Hyperinflation report (of April 2008).

Williams states that "what promises hyperinflation this time is the lack of monetary dicipine formerly imposed on the system by the gold standard, and a Federal Reserve dedicated to preventing a collapse of the money supply and the implosion of the still, extremely over-leveraged domestic financial system."

Williams believes the US will experience hyperinflation as early as 2010, if not before, and likely no more than a decade down the road from today. The US can no longer turn around and avoid financial Armageddon. As I've previously stated, the US and the world can only print money to meet existing debts and future obligations. The US Dollar will eventually collapse and be worth its true value – nothing. The same result will happen to the Australian Dollar, the Euro etc. All currencies today are paper money or fiat. It is no longer backed by an asset of value, namely gold. It is backed by our confidence in government. Throughout history all fiat currencies have collapsed.

Interestingly for many, Williams also details that the next US President is highly likely to be a Democrat (Obama) based on a simple economic calculation. "In every Presidential race since 1908, in which constant, real (inflation-adjusted) annual disposable income growth was above 3.3%, the incumbent party holding the White House won every time." Below 3.3% growth, the incumbent party would lost every time. "(today) the current annual growth in real disposable incomes is at 2.2%". ie. a victory for the Democrats.

I will repeat again, regardless of whether it will be Obama or McCain, both candidates will follow the Federal Reserve and print, print, print its ways towards hyperinflation and the US Dollar will eventually collapse. Neither candidate is looking at the root causes of sub-prime, the collapse of the investment banking model, the collapse of the US Dollar. The root cause is Government! It is Government which severed all ties to the linking currency with Gold in 1971. It is Government which created the Federal Reserve in 1913 (a market manipulator). It is Government which has encouraged business and individuals to use Keynesian economics – the system which encourages: inflation, debt and the devaluation of the currency. The world will head to a great depression and remain in a great depression until a leader is elected that recognises these facts! Ron Paul was the only Presidential Candidate this time that understoodd the flaws to the current monetary system, however he was not popular today because the masses want free money thrown at them to fix the system. Printing money will not be sustainble to meet medicare obligations, social security payments etc. You have to keep adding more wood to the fire to keep it going.

The Great Depression will end when currency is linked back to gold (real money).

The world got out of the last Great Depression in 1944 due to the creation of the Bretton Woods system, not because of World War II as most historians recite. After WWII, the world had no workable monetary system. The system had to be re-drawn because the United States had accumulated a bulk of the world’s gold and silver during the war from other countries which took loans from the US. (The US Government had about 6 billion ounces of silver – today it has none!). In a nut shell, the monetary system created at Bretton Woods (in the US) linked currency back to the gold. The US Dollar became the world currency, and would be redeemable to gold at US$35 per/ounce. The system ultimately collapsed in 1971, because France started cashing in its US Dollars for gold. Other countries started to follow, and the US lost over half its post-WWII gold reserves. Bretton Woods was far from a true gold standard; it was a quasi-gold standard and was fundamentally flawed. Gold is finite.

It all comes down to economic accountability. The United States, Australia and the world has been using an economically irresponsible monetary system. Throughout the last century, the strings have gradually been released, moving the system from gold (economic discipline) to all-out "government backed" fiat currency. If an individual does not pay off their credit card, the bank with eventually cut it up in front of you. Central Banks around the world are on the verge of cutting up the US Dollar in front of the US Government, and consequently all world fiat currencies. The fiat system only works because of confidence in government. This confidence will collapse due to the forthcoming hyperinflation great-depression. Paper money won't be worth the paper it is printed on.

Best,
Scott

Saturday, September 27, 2008

Not the time to be an arm chair analyst

Washington Mutual

This week it was Washington Mutual (WaMu) - the biggest savings bank to go under in US history, but perhaps not officially... JPMorgan came to the rescue! and will pay US$1.9 billion for the troubled bank. If Washington Mutual was not taken over by JP, there would have been a massive bank run on its deposits, and likely the start of substantial withdrawals from other US banks. A bank run happened earlier in this year when IndyMac Bank (California based) went under, at the time it was the 2nd largest bank failure in US history. (There are new records created every week at the moment!) WaMu with assets of $US307 billion, easily beats IndyMac ($US32 billion), and Continental Illinois National Bank ($40 billion) which went bankrupt in 1984.

With JP stepping in, the US Federal Deposit Insurance Corp (FDIC), which insures US bank deposits, was let off the hook (not a coincidence I believe). Without JP at the scene, FDIC would have been forced to cover the savings held by Washington Mutual.

Who is FDIC?

As the FDIC website states:

- (FDIC provides a) basic insurance amount is $100,000 per depositor per insured bank.
- If you and your family have $100,000 or less in all of your deposit accounts at the same insured bank, you do not need to worry about your insurance coverage -- your deposits are fully insured.
- FDIC insurance is backed by the full faith and credit of the United States government.


The irony is that FDIC was created in the midst of the last Great Depression in 1933, because of a huge amount of bank failures and loss of confidence in banks. Today, many Americans would have confidence in this corporation (if they were aware of it) to back their savings if there was a bank run. The bottom line is - this corporation is all "smoke and mirrors", and it will not be able to cover a massive bank run when the next one happens. If it did honour deposits in a large run on the banks, the US would have to print trillions of dollars to meet its obligations. The ultimate end result is hyperinflation.

In the last Great Depression more than 1 in every 5 banks failed. Between 1929 and the end of 1932, nearly 5,100 banks had failed in the United States. Money supply shrank by one third, as people were not prepared to take out new loans (liquidity problem - sound familiar?). There was no confidence in the banking system. FDIC was created to help restore confidence in the banking system, by backing deposits with the "Faith" of Government (but it didn't work...). As I have raised previously, the US Government will only be able to print money to meet future promises, liabilities, and obligations.

Arm Chair Analyst

Everyone has an opinion. Right now more people are interested in talking about whether it will be Obama or McCain as the next US President. The bottom line is - it doesn't matter anymore. Whoever gets in will only have one economic card up their sleeve, and that is to keep printing money, devalue the $US Dollar (relative to other currencies and gold/silver), and erode the purchasing power of the US economy through a double digit inflation tax. There are differences between candidates, but economics is the primary element to capitalism. People need secure assets, secure jobs and a secure monetary system. Without this, social, environmental, military progress etc is not sustainable.

Now is not the time to be an arm chair analyst.

There will be many people that will say in a few years time:
- "I knew the $US Dollar would collapse"
- "I knew gold and silver prices would go crazy"

Words are worthless if you do not back them with actions. Forget the tabloid-trivial politics. Do not rely on populism or mass-media propaganda. They will always distort the facts. Whether its climate change (how many jorno's have a degree in schience and climatology?) or the nightly finance report (who cares if Telstra goes up or down 1 cent?). You must do you own research and due dilliegance, and question everything the pollies or the mass media tells us.

Three Teirs to Action:

1) Education - Spend X hours a week studying the events happening in the US. What does WaMu. Lehman Bro's, $700 bn rescue package mean today, but more importantly what will this mean for tomorrow?
2) Have a plan that recognises the period ahead. How will your preserve and duplicate your wealth? How will your combat eroding purchasing power to double-digit inflation?
3) Accumulate holdings in precious metals.

Change your context

When you realise the seriousness of what is about to hit the world economy, a light bulb will go off in your head. You will be consumed to learn as much as you can about the current events and what you must do to preserve and transfer your wealth.

So far I have detailed many facts and figures, but this will mean nothing unless you change your context. We have to stop measuring things in terms of paper money (US$, A$, Yen etc), and instead measure things in terms of purchasing power.

Already we are around 8 years into a great precious metal bull market, but very few people are aware of it. Gold and silver will offer the greatest purchasing power, and wealth transfer for the decades ahead. Those holding gold and silver will do very well, provided they have a plan and do not flip and sell for currency "profits" along the way.

There is a lot to take in - but the more knowledge you have, the better equipped you will be to take action early - but only if your context has changed and your inner instinct forces your to take action...

To finish today, I suggest wetting your appetite with some of the video clips below.


Cheers,
Scott

Monday, September 22, 2008

What is $700 billion worth?

One page 13 of the Australian Financial Review today, there was a comparison on the cost of the US$700 billion emergency rescue package Bush is about to put forth to the US Congress.

$700 billion works out at:

* US$2,000 for every person in the US
* More than the GDPs of Argentina and Chile combined
* 70 percent of Canada's GDP
* The annual Pentagon budget, including the wars in Iraq and Afghanistan
* 20 percent of what the US spent in WWII
* Twice what the US spent in WWI
* More than twice what the US spent on the Korean WAr
* 100 times what the US spent in the Spanish-American War of 1898
* 100 times the annual cost of the US Heat Start program, which helps 900,000 children from poor families
* 40 times the NASA budget

Here are some of my analysis:

- To put it into Australia's context - the US$700 billion is 77% of Australia's GDP!
- The amount is also akin to a mini- US budget, roughly about 1/4 of the expenditure of a usual US budget today.

$700 Billion in context of existing US Government Debts

- In 2008, the US Government spent $431 billion in interest repayments on the existing debt, which currently totals over US$9.7 trillion. Obviously current debt is already unstainable and past the point of no return. The US Government collects about $2.66 trillion in taxes (2008), so interest on debt is one of the largest expenditures on its books, representing about 16% of total revenues!


ASX opens at 11am?

On a somewhat different note, the ASX didn't open until 11am today. I thought Comsec had spat the dummy again. The Australian Securities and Investment Commission (ASIC) decided at the last minute to ban all types of short-selling in Australia (naked and covered), in response to moves by the US and UK last week. Freezing short selling always tends to happens in times of economic uncertainty. I believe there are pros and cons for short selling (naked shorts are the dangerous ones). ASIC really should have got things sorted before today. The confusion in the market was just not needed, especially with whats been happening in recent weeks. When the market did open, most stocks has huge gaps, such as MQG (up 17% on open) and FMG (up 31% on open!). Most then drifted lower during the day. Nothing like seeing short sellers buy up (to close positions) in a market frenzy...

Cheers,
Scott

Sunday, September 21, 2008

The most economic volatile week in history?

Was last week the most economic volatile in World history?

Following from my last post on Monday, we have witnessed even more extraordinary events this week.

- After Lehman Brothers filed for bankruptcy (the biggest in US History), AIG, the world's largest insurer was bailed out of potential bankruptcy by the US Government.

- British bank Lloyds TSB agreed to buy rival HBOS to create a 28 billion pound ($63.9 billion) mortgage company. HBOS was
Britain's largest home loan lender

- Current speculation is that Morgan Stanley and Wachovia are in talks to merge, and that Washington Mutual, the USs' largest savings bank is in trouble.

- Gold had its largest one day (*market*) spike in history, up a lazy 8.9%.

- Over the weekend, the United States Treasury unveiled a $US700 billion ($A871 billion) rescue plan for the troubled US financial sector. With the stroke of a pen, this would be equivalant to the US increasing its money supply by about 7 to 8 percent! (assuming M3 money supply is currently about US$14 trillion).
The US GOvernment will aquire up to US$700 billion in home and commercial mortgages from US-based banks over the next 2 years. To do this, the U.S. government's debt limit would rise to $11.315 trillion from $10.615 trillion.


Short Selling

On Friday both the the U.K. Financial Services Authority and the US Securities and Exchange Commision (SEC) took action to prohibit some short selling practices and to require much greater disclosure of short-shorting selling positions. This had huge implications for the world markets on Friday.

On Friday:
* The FTSE was up 8.8% for the day.
* The Dow Jones was up 3.4% for the day.

The main reason why the FTSE and Dow went so strong is because short sellers were closing a lot of their positions! To close their position they must buy. (its opposite to going long. They sell high first then buy low to close position, as opposed to buy low, sell high).

United Kingdom:

On Thursday the UK Financial Services Authority halted all short-selling of financial companies, which would be in effect until 16 January 2009 (but may go longer).

United States:

On Friday the SEC announced, effective immediately, that 799 financial companies would be protected from short-selling practices until 2 October 2008. There is talk congress may even put a bill together to constrain short-selling altogether.

Australia:

The Australian Securities Exchange (ASX) on Friday said that it would prohibit naked short-selling from tomorrow on all securities, while covered short selling will require greater disclosure.

This, along with the surge in world stockmarkets on Friday, will likely lead to big gains on the ASX tomorrow. Banks and financial stocks in particular should do very well, along with any stock which has been short-sold heavily in recent months such as Fortescue Metals. (ie. stocks which have large amounts of debt!)


Investment Bank Model Dead?

For now it appears the only large investment bank left in the US is Goldman Sachs. Bear Stearns and Lehmans are gone. Merrill Lynch has merged, and Morgan Stanley is believed to be on the cusp of merging. This is a huge turn around inside 12 months! The following graphics show how the US financial scene has changed so quickly for 29 (now 26) of the biggest financial firms.

Source: http://www.nytimes.com/interactive/2008/09/15/business/20080916-treemap-graphic.html

Chart 1: Market cap of 29 selected financial stocks as at 9 October 2007

Chart 2: Market cap of 27* selected financial stocks as at 12 September 2008
Result: These 29 companies have lost almost US$1 Trillion in market capitalisation, with the total financial sector loosing about US$4 trillion in market capitalisation so far.

Macquarie & Babcock to follow?

All through this weeks turmoil Australia has largely been untouched (so far). However, concerns of Australia's two investment banks made Macquarie Bank (MQG) plummet 23 percent on Thursday, before rebounding 37 percent on Friday. Babcock and Brown (BNB) hit a low of 68 cents on Thursday. BNB was over $30 dollars per share in November 2007. It has now fallen 97% in only 10 months!

In my opinion Babcock and Macquarie will not survive - its a matter of timing. Macquarie today is in a lot better shape than Babcock of course but it too will not be able to weather the global economic crisis which will progressively get worse in the next few years.

The investment bank model is built on debt and expectations. Assets are geared with a lot of debt on the basis that the assets will continue to appreciate in time and that revenue streams would appreciate in time. Some of the world's largest investment banks have gone under because the cost of debt (and the loss of liquidity) has gotten out of hand. Macquarie and Babcock own long-life assets which used to be owned (or provided) by governments. Airports, ports, roads, power stations etc. Expensive assets which have large sunk costs and require substantial maintenance.

For example, the toll-road model is flawed, and there are a number of toll road floats on the ASX in the last couple of years. They are built on over inflated expectations of usage. These expectations are used to finance the equity and (mostly) debt to get the roads built. Governments know exactly how expensive roads are to build and maintain, investment banks are only now waking up to economics101. Economies have booms and busts, but the investment bankers believe we will always have booms.. The big global boom is over, and now we are heading for one of the biggest busts in world history. Its all a matter of timing.

Right now though, We are currently experiencing first hand the worlds worst financial crisis since the last Great Depression. The populus (in the US, Australian and the rest of the world) still has a tremendus amount of confidence in Government and their ability to print their way out of financial demise. This won't and can't last forever. The more money they throw, the longer they put-off the inevitable collapse, and the more money there is to fuel inflation. I predict hyperinflation will eventually come into play and this will be the catalst to bring about a loss in confidence in Government (whom backs our currency, our money supply).


Until next time,
Scott

Monday, September 15, 2008

The Derivatives Bubble - signs of the iceburg underneath?

Today in History:

Today we have seen the fourth largest investment bank in the world, Lehman Brothers files for bankruptcy. This follows Bear Stearns (who got bought for $2 p/share by JPMorgan) in March this year.

Bank of America pays US$50 billion (A$60 bn) for Merrill Lynch.

Also today, 10 Global banks had "pledged" to throw $US70 billion to help the credit squeeze. Drop in the ocean! I thought they would be more desprite then that...

What is a derivative?

Derivative are essentially bets. They are usually in the form of futures, forwards, options, and swaps. They are used to hedge risk, to speculate future events, and to provide (often significant) leverage to the investor.

There are scores and scores of different derivative products.

Impact of derivative so far:

The sub-prime mess was born through property derivatives. Bundled up mortgages, securitized and sold to foreign investors on the assumption property prices would continue to increase over time.

The US is now witnessing the first of the derivatives bubbles. The Property market bubble. In only 5 years US residential property debt grew from US$4 trillion to US$12 trillion. As discussed previously, Fannie Mae and Freddie Mac have now been bailed out by the US Government to try and hold the mortgage system together.

Derivatives compared to world GDP:

In 2007:
* World GDP is around US$53 trillion.
http://en.wikipedia.org/wiki/List_of_countries_by_GDP_(nominal)
* Total derivatives market is believed to hit a record in 2008 at over US$750 trillion!

Derivatives have exploded in recent years to be 15 times the size of the world economy. So for every $US dollar being created through goods and services, there are $15 dollars being gambled in the derivatives market!


The Big Three that will ultimately bring the down the world economy?

Remember these 3 banks.

As of March 2008:
* JP Morgan - US$90 Trillion in derivatives
* Bank of America - US$38 Trillion in derivatives
* Citigroup - US$38 Trillion in derivatives

These three banks alone are betting 3 to 4 times world GDP.

The top 25 US banks derivatives exposure is detailed in the table below.

Table 1: source: http://www.occ.treas.gov/ftp/release/2008-74a.pdf (p. 25)

As of 14 September 2008, JP Morgan had a stockmarket capitalisation of US$141 billion, yet according to the US Treasury, the company has potentially $480 billion dollars at stake from derivatives trading alone!

What about Derivatives exposure in the rest of the world?

The rest of the world is knee high in derivatives.

For an overview of the world situation (by currency, instrument etc) see the Bank of International Settlements website.
http://www.bis.org/statistics/derstats.htm

For further study on the Derivatives Bubble ahead I recommend seeing these two video clips as a starting point.


Ponder this last thought:

Two third's of banks in the US filed bankruptcy in the last Great Depression. Lehman Brothers was one of the few that survived this period and went on for 158 years until... today.

Study the past (monetary history) and you will see the future. We live in interesting times.

Cheers,
Scott

Saturday, September 13, 2008

Money Supply, Debt, Inflation and Purchasing Power!

Today I detail over money supply and what this means for inflation, purchasing power and the world economy.

What is Money Supply?

- is the total amount of money available in an economy at a particular point in time.
(http://en.wikipedia.org/wiki/Money_supply#cite_note-18)

Money supply used to be backed by a gold standard. However all this changed in 1971 when the Bretton Woods system fell apart. Today money represents debt. The total supply of money is infinite so long as there is debt in the economy. No debt = no money being created.

Money supply and Inflation

To leverage our potential buying power we borrow money (debt) to be able to buy more goods then what we could have done otherwise. However, the first rule in economics is that we have unlimited wants, yet limited resources. So at its most basic level, the more money supply in existence (created from loans), the more money there is competing for food, land, labour etc. This leads to price inflation and increased volatility and uncertainty in the economy. Booms and busts become more extreme.

How do you measure Money Supply?


In Australia the RBA define Money supply as:

M0: currency

M1: currency + bank current deposits of the private non-bank sector

M3: M1 + all other bank deposits of the private non-bank sector

Broadmoney: M3 + borrowings from the private sector by NBFIs, less the latter's holdings of currency and bank deposits

M3 is generally used by economists to estimate the total amount of money available in the economy.

What increases money supply?

Every time someone borrows money from the bank, the money supply expands. If you get a new mortgage for your house, or a margin loan to buy shares, you are helping increase the money supply and you are leveraging credit. Through fractional reserve banking, banks have the ability to make money out of thin air. If the fractional reserve is 9 to 1, you deposit $1,111.12 dollars into a bank, the end result is that the original $1,111.12 can ultimately create almost $100,000 of new money!

Movie: See Money as Debt to understand how our Monetary System works today (part 1 of 5 below)


Governments can increase money supply by spending more than they tax (one of the big reasons for money supply growth in the US). US money supply has expanded significantly in recent years due to a double whammy of tax cuts and increased expenditure.

Central banks try to manipulate money supply through interest rates. Central banks do this by buying and selling government securities (and other financial instruments). Ultimately, central banks can only do so much to influence money supply. As we saw in the US earlier this year when the Federal Reserve cut interest rates quickly and threw a $168 billion stimulus package, there was short-term elation, but has ultimately did little to prevent the stockmarket and property prices from falling much lower.

Only a very small portion of money supply (M0) is in the form of currency (notes and coins) generated by a central bank to meet physical withdrawals. This is usually less than 5% of the money supply.

What decreases money supply?

When someone pays back their mortgage (or other debts), money supply decreases. Money supply also decreases when someone defaults on their mortgage or closes a margin loan account, or the Government reduces expenditure and runs surplus budgets.

Central banks try to decrease the rate of money supply growth by increasing interest rates and providing disincentives for people to take out mortgages, margin loans etc.

Ultimately today's monetary system needs money supply (and consequently debt) to keep increasing for the economy to function.

Australia's Money Supply

Putting some numbers on money supply growth and using Australia as a case study, we can see that historical through-the-year growth in M3 has been very strong.
Cumulative:

- In the year from July-2007 to endJune 2008 M3 increased 23%
- In the last 5 years (to end of 2007) M3 increased 82%
- In the last 10 years (to end of 2007) M3 increased 174%
- In the last 20 years (to end of 2007) M3 increased 563%
- In the last 30 years (to end of 2007) M3 increased 1847%

As at June 2008, M3 totalled over A$1 trillion Australian Dollars.

Chart 1: Australia's historical through-the-year growth in M3.

Betweem 1971 and 1990, Money Supply growth was very volitile and tended to grow over 10% per annum. The 1990s till 2006 growth was between 5 and 10% per annum. It now appears we are heading for volitile times again.A spike in money supply will trickle into increased inflation.

Chart 2: Cumulative growth in M3 (A$ billions). An exponential curve. As MS increases, debts owed increases.


Chart 3:
Log scale of Australia's M3 money growth.

Note the elasticity has been quite constant over time.

The US Money Supply

Since 1944 the US Dollar has been the world currency and until 1971 the $US dollar (and consequently currencies around the world) was linked to gold. Removing the link to gold essentially gave central banks around the world a blank check to print as much money as they want, as the amount of gold under vault no longer constrained how much money supply could exist in the economy. Money is now backed by our confidence in Government (whom guarantee coins and notes are legal tender). The paper used in a $50 dollar note is no more valuable then the paper used in a $100 dollar note – the only difference is that the Government assures us that one is more valuable than the other.

Is US Govt trying to hide something?

In March 2006 (see chart 4), the US Government ceased publishing its M3 money supply data. The reason? To save money!?


Chart 4:
United States money supply

M3 was well over US$10 trillion dollars in early 2007.

The simple fact is there is so many $US dollars out there today! (remember a very small amount is actually printed notes and coins ie. M0). As the $US Dollar is the world currency, today about 50% of the world's currencies is in $US Dollars, and about 50% of the $US Dollars reside outside the US! So non-Americans have also contributed significantly to the growth of US money supply.

The US Govt is trying to hide the true rate of inflation. As money supply increases, the new money has to find a home. More money becomes available to compete for finite resources such as food and property. This is why there is always bubbles in property markets, the sharemarket etc. as more money is created through larger mortgages, larger margin loan portfolios etc. All this leads to inflation and ultimately hyperinflation. At the top of booms there is often deflation. This is when buyers hold off from buying in the expectation that prices will be cheaper in the future. Those struggling with their finances are are pushed to sell (to clear debts) are forced to sell to the nearest buyer. People may think their home is currently worth A$1 million dollars today, based on recent prices. However it is only worth $1 million if you have a buyer willing to sign on the dotted line. Your $1 million house might be only worth $800,000 if that’s where the first buyer is. This is deflation.

The $US Dollar = smoke and mirrors

We are constantly reminded by the daily news reports that over the last several years the $US dollar continues to depreciate against other world currencies (namely the Euro). However, in the last few weeks all we have heard is about the rising $US Dollar. I'm expecting this move to be a short-term pull-back, with the long-term downward trend to continue on its way.

As the $US Dollar is the world currency, it has been used as a base reference to provide a measure of value. For example, we hear the price of oil in $US per barrel or copper in $US per pound. Exchange rates are always first compared to the $US Dollar before other currencies. This continues to disguise the true value of assets. The world knows the $US Dollar is becoming more and more worthless over time. Many OPEC member countries are pushing for the $US Dollar to be dropped as the reference currency in favour of the Euro or a basket of currencies. OPEC knows the $US dollar is disguising the true value of their oil!

Is it a coincidence most basic food prices such as rice, wheat and corn have spiked dramatically in the last year? Rice has trebled in the last 12 months, yet the number of people eating rice hasn't gone up dramatically compared to say 24 months ago.

Ponder this. As more people in developing countries go from the poor class to the middle class, deposable incomes increase, and consequently the money supply. There is now more money (supply) chasing a finite resource. Add on top of this, there are hedge funds and large institutions in the futures (derivatives) markets, which help push prices higher (fuelling expectations). This all causes a bubbling of price inflation. As people soon realise they are spending more of their income on food, fuel, rent etc, wage demands increase, which economists argue is the main cause of inflation.

It's all about price expectations! If people expect higher prices, they will factor this into their spending habits. People gradually expect that fuel will cost more. Rice will cost more. Steel will cost more etc. If people expect higher inflation, they will ultimately receive higher inflation (and more money supply).

The US dollar has lost about 97% of its original purchasing power (of 1913) to inflation! The Australian Dollar has lost about the same amount of value, as have most other fiat currencies.

The Euro

A quick word on the Euro.

Chart 5: The Euro M3 money supply is fast approaching the size of US dollrs and is now about 9 trillion Euros.


Conclusions and predictions for the long-term:

- Money Supply growth tells us about the future. The faster it grows, the greater price inflation will be - "the new money has to find a home" - in food prices, in rent prices, in commodity prices etc. There is a time lag for this new money to go through the system and find a home.

Australia:
- Australia's money supply is going to expand rapidly between 10 to 25% plus, and should be volatile like in the 1970s due to uncertainties and expectations in the economy.

The World:
- The $US Dollar will continue to depreciate against most world currencies, however compare any world (fiat) currency to gold/silver/oil and they are all falling.
- The true rate of inflation in the $US is much worse then the US Government is publishing.
- Measuring goods in $US Dollars is disguising the losses in purchasing power.
- The Euro is fast becoming the new world currency; however the Euro’s money supply is increasing at an alarming rate.

In the near future I intend to cover off on some key value indicators. Namely: gold/silver ratio, gold/oil ratio, gold/Dow ratio and go into more detail on purchasing power.

Until then,
Scott