Saturday, November 20, 2010

Who will save China?

In few months its become apparent that more and more reporters are jumping on the “China is vulnerable after all” bandwagon. I have had this view for some time now, and this post will examine a few reasons why China is as-vulnerable as many other countries in the world. Australia is very vulnerable because we are so reliant on China and commodity prices.

The Chinese Miracle?

The growth of China's economy in the last 15 years is nothing short of a "miracle". Compared to the other miracle economies, the 4 Asian tiger economies up to the 1990s and more recently the Celtic Tiger (Ireland - the roaring tiger of Europe - look where it is today!), China is in a completely new ball park. No country in history has built so much stuff in such a short space of time. World production of materials is mind-boggling. China can do it all, and in turn is de-industrialising higher-cost manufacturing in the western world. Demand for iron ore, coal, copper right down to steel and concrete has exploded. But can China perpetually build more and more steel mills and skyscrapers?

Well, no...

China is vulnerable to economic depression. The common denominator in every country is that all the banks operate under insolvent conditions, its just that the citizens rarely force a bank run to prove this Achilles’ heel. The main point here is, the common base line in every country today is the type of “money” used. The US Dollar, Australian Dollar, Chinese Renminbi and the Zimbabwe Dollar are all fiat currencies. Whilst there are significant differences in value of these currencies (or rather the rate of devaluation/loss of purchasing power), all currencies around today are still “fiat”, that is, money which is declared by Government to be legal tender and without intrinsic value (no gold backing). Through fractional reserve banking ("Money creation") and printing new money into existence the rate of economic growth in any country can be very rapid for a number of years. However, all good parties end in one big hangover. China's hangover is coming (particularly if they do not prepare for post US-Dollar monetary system).

Now that we have apparently coming through the worst of the so called Global Financial Crisis (GFC), every second economist on the street has hailed China as the world’s savour, and indeed in Australia, the Deputy Governor of the Reserve Bank of Australia RBA), Ric Battellino, believes the commodities boom could last for another 15 years – all of course, thanks to emerging economies of China and India.

Whilst I agree that China has helped the world during the GFC, and that we will continue to be in a long-term commodity boom, my reasons are completely different. And here is why:

• Chinese Banks inflated the world out of the 2007-2009 Global Financial Crisis
• The Commodity Boom over the next 10 years will be extremely volatile

Chinese Banks on steroids…

Answers to the future often lie in history. China invented paper money way back in the 10th Century AD. Every single paper-fiat currency created since (except for those existing today) have collapsed to a net worth of zero. Fiat currencies will always come and go because Government's cannot resist the temptation to use inflation to pay for election promises (or to help keep opposition parties out of government..). China, and every other country will not be able to defy economic reality with fiat currency this time around either. Keynesian economics will hopefully follow soon after.

As the following two graphs demonstrate, it’s the major global bank’s that fuelled the sub-prime bubble (in the US) which led to the GFC, and then subsequently it was Chinese stimulus spending and bank lending which helped the world get through the worst of the GFC. China just filled the void to get the world through the first phase of economic depression. This banking bubble is completely unprecedented. There is still many decades of debt still in the system - which is yet to be paid (accounted) for.

Chart 1: Global banking bubble
source: ABC News

Chart 2: Chinese banking bubble... but who will save the Chinese banks!?

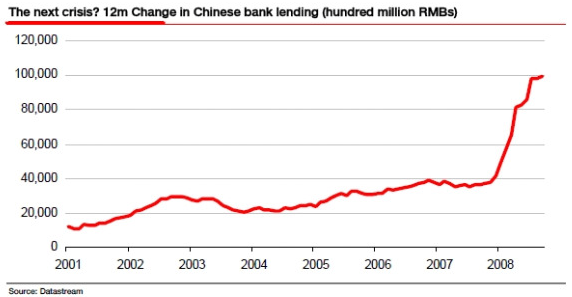
The RMB¥ 4 trillion (US$ 586 billion) Chinese economic stimulus plan announced by the Chinese central government was all aimed at getting Chinese companies to build more Chinese goods and buildings. As I will explain a little bit on, China was already building at a very fast and unsustainable rate. This stimulus inevitably brought forward work and is now creating double digit inflation to their economy. Increasing credit always delays and make bubbles worse.

As consumer confidence was low in the US, and China, Japan and Asia were unable to keep exporting products to the US consumer, China took up the slack and increased bank lending dramatically, converting their economy from being strongly export-oriented (to the US) to fuelling domestic demand through stimulus. The Chinese Economic Stimulus Plan was used to offset the sub-prime housing crisis in the US to counter-act it with a Chinese property bubble. In essence, creating a new bubble market to replace a busting bubble market. The end result, I strongly believe, will have dire consequences to China, and Australia and the rest of the world. Like holding out a red flag to a charging bull, China will soon get caught out.

For now the commodity boom will continue, but… the next 10 years will be characterised by extreme volatile periods of double digit annual growth to significant periods of price deflation. Ultimately, gold, silver and soft commodities (food) will be sought after on-mass. People will change their spending habits to have economic security.


Construction, construction, construction!

Construction now makes up 60% of China's GDP. This compares to single digit GDP for China's total exports. China is building and manufacturing absolutely everything for the world, ten times over (or more?)

James Chanos:
No country has ever had done more than 9 years above 33% of GDP (in fixed assets – construction). China is now on its 12th or 13th year.


You gotta be in property! (especially if you are a central government)

In August this year the Financial Review ran an interesting article (lost on page 60) on China's central government trying to cool its property bubble. The article reported that all sorts of random companies were delving into property, from salt companies to railway companies. It goes on...
All around the nation, giant state-owned oil, chemical, military, telecom and high groups are bidding up prices on sprawling plots of land for big real estate projects unrelated to their core business. ...

By driving up property prices, the state-owned companies are working at cross-purposes to the central government's efforts to keep China's real estate boom from becoming a debt-driven speculative bubble.

Records show 82 per cent of land auctions in Beijing this year were won by big state-owned companies outbidding private developers - from 59 per cent in 2008.

Further:
land prices in Beijing had lept 750 per cent since 2003, and that half of tha gain had come in the past two years. Housing prices have also sky-rocketed, doubling in many cities over the past few years.

And as the prices of new apartments soar - in Shanghai, for instance, they often exceed $US 200,000, while the average disposable income isa bout $US 4,000 a year.

The article also made reference to the status of the state-owned banks. They they:
- had made $US 1.4 trillion in loans, nearly twice as much as the year before
- were making off-balance sheet manoeuvres
- were likely sitting on enormous unreported debt

Lastly, the article argues that different levels of government were behind the push in real estate because it was so "incredibly lucrative". Many municipalities have formed local investment vehicles that borrow from state-owned banks to pay to relocate citizens to build on their land, so the government can then auction off the new properties for profit.

Does this all sound like Sub Prime Mortgages on steroids times by a factor of 10?

Housing Affordability in China
One clear clue (regarding the rising real estate prices in China) is that the average price-to-income ratio in Beijing has reached 27:1, five times the world average, according to data from the Bureau of Statistics of the Beijing Municipality. In addition, the average price-to-rent ratio neared 500:1 in the city, far above the international alarm threshold of 300:1, which sends out a clear signal that the foundation of the real estate boom is losing stability.


Steel production up 6 fold in 10 years

To further put this into perspective, all this construction material had to come from somewhere. Of course, in Australia we know about the China boom and our record iron ore and coking coal sales have led to our highest terms of trade since the early 1950s.

Australia has helped fuel the great Chinese construction bubble. In 1999, the Chinese steel industry produced some 124 million tonnes of crude steel. This was a similar size to Japan and the United States. For comparison, in the same year Australia produced about 8 million tonnes. The following two charts illustrate the magnitude of China's construction mania.

Chart 3: China produced 16% of total world steel in 1999
source: World Steel Assoc. (public data)

Chart 4: 10 years later China now produces more than 46% of total world steel output
source: World Steel Assoc. (public data)

China’s steel production has gone up almost 6 fold in the last decade. To put this in perspective Australia’s steel production is now about 1% of China’s (or 0.5% of world) total annual steel production. ie. China produces Australia’s total annual steel production in just 5 days! China is now making more steel than what the entire world produced in around 1990.

To analyse this from another perspective, there are more stories in the media in recent years of ghost cities and empty mega malls springing up in parts of China.

Video: Fuelling the next housing crisis – this time in China

China also has the world’s largest shopping mall, the New South China Mall (based on leasable area) remains 99% vacant since opening in 2005. (video now unavailable)


Centrally planned economies do not work

Centrally planned economies have never worked over the longer term. I am not debating the nitty gritty of what the difference between communism vs. capitalism is, at the end of the day, the more intervention by Government’s and, particularly, central banks, the more mis-allocation of labour and capital there will be. The end result is massive overcapacity and ultimately price suppression (monopolistic behaviour on other countries). China is an extreme case at point, where the central government right down to municipal governments have had competing interests to increase employment at all costs. The municipal/provincial governments have also been competing for trophy industries, they all want to be the biggest and best at manufacturing, particularly steel and automobile industries. Exponential growth in credit, employment, and government intervention in markets eventually comes to an abrupt halt.

Far from what many economic commentators in Australia preach day in day out, that China is Australia’s economic savour amongst the global uncertainty in Europe and the US. To the contrary, I believe our over-reliance on China will ultimately bring harsh repercussions for Australia. On one side, China and the US will kill off the commodity boom. The biggest mining boom in history, inevitably will end in the biggest mining bust. The expansion plans of BHP Billiton, Rio Tinto, Fortescue Metals (among others) will result in major overcapacity, and empty ports. A huge call, perhaps crazy in today's climate, but this endless expansion will not keep going. Many of the major projects will be mothballed. Marginal projects will once again be marginal and left on ice for easy money to come around again.

James Chanos sums up the current situation rather nicely. James is best known for seeing the problems of Enron and shorting its stock up until its collapse. He recently warned that China's hyper-stimulated economy is headed for a crash, led by its housing bubble.
Its become very apparent... that China has embraced capitalism to keep the socialist elites entrenched, while more lately in the West we have embraced socialism to keep the capitalist elites entrenched. It’s a little bit of the opposite side of the same coin.

** Note ** I am soon to launch a new website at www.scottreeve.com, which will incorporate this blog and other areas of interest ~ Cheers, Scott

Thursday, May 27, 2010

The Great Australian (ponzi) Scheme

Back in February 2008, while the so-called GFC was taking hold I posted at length stating several reasons why I believed the Australian Housing (bubble) market was destined to burst. This post will extend on previous thoughts.

Raise your hand if your living the Great Australian Dream?

In past decades the Great Australian Dream became reality for many who rode the debt wave of the 1970s, 80s and 90s. The dream was an expression of financial security as nothing was "as safe as houses". Fast forward to today and Generations X, Y, and Z have little more than a pipe-dream of affordable living and affordable mortgages. We have to try to keep up with the Jones (Baby Boomers), or complain from outside (like i'm doing here). For now, some younger Australians may do well in the short term by embracing government first-home owner handouts, multi-decade low interest rates and other incentives to try to live the dream... and for now Australia is apparently defying gravity. I believe the dream will cause long term indigestion for some, for decades to come if people do not have a backup plan once asset deflation hits Australia on mass. Liquidity on hand will be king (gold/silver not Australian Dollars).


2009 – house prices hesitate and take off again.

Australian house prices ended up rising 1http://scottreeve.blogspot.com/2009/02/beware-australian-housing-debt-bubble.html, the fourth highest growth rate in the world behind Hong Kong, Mainland China, and Israel. However, globally house price deflation continues with house prices falling by 3.8 per cent, led by Ireland, Dubai and Eastern Europe. In my post last month, there is an excellent graph highlighting the next wave of delinquent mortgages on the way (1 in 7 trouble). China will follow, and i'll post more extensively on its problems.

Chart 1:
source: Australian Financial Review, March 2010

Chart 2: Australian house prices by city
source: ABS

Chart 3: The dip and the rebound...
source: ABS

The great Australian ponzi scheme continues upwards again. The combination between unprecedented population growth, low housing starts, government handouts, very low (central-bank manipulated) interest rates, and double-digit M3 inflation growth in the system (during the GFC period) ensured that there would be enough fuel to get more buyers into the Australian housing market. Externally, more and more money is coming from businessmen in China, India and elsewhere whom currently see Australia as a place to invest their savings for a return.

Lets examine each of these issues more closely.

A) unprecedented population growth

Chart 4: 300,000 to 400,000 net new people each year now... lets make the aging population problem (and hospitals) worse.
source: ABC News

Chart 5: Govt: "Even if there wasn't a "real" shortage... lets create one"...
source: ABC News

That's a lot more people that need to consume and a roof over their head. A lot more people that might be bringing valuable skills to Australia right now (a quick fix? ...), but eventually will also add to the hospital cues (and potentially unemployment ques when the economy goes pear shaped). The aging population is still aging!

B) Housing Starts manipulation

As the following graph demonstrates, the three levels of government have successfully been manipulating the supply-side of the housing market, by staging land releases. Arguably, the three levels of government in Australia are the most addicted to keeping Australian housing prices upright, and the most to loose when asset-deflation sets in. Primarily, strong price growth in housing equates to overall consumer confidence in the market, and ultimately confidence in government economic management. Further, local governments remain fixated on housing rates to raise revenue to spend on local roads, while revenue-deprived state governments grow increasingly reliant on land and stamp duty taxes. A blow in confidence in the housing market is a blow to government revenues (direct taxation), but ultimately a total decline in confidence will flow through to less employment (income tax), business profitability etc.

Chart 6: It's in Government interest to not flood the market with too much land...
source: ABC News (RBS data)


C) Government handouts – 1st homer owner loans

In the first stimulus package (A$10.4bn) announced in October 2008, the Rudd Government introduced a First Home Owners Boost to go onto of the First Home Owners Grant. With interest rates cut to four decade lows, this just added further candy to the honey pot to entice young Australians into the housing market. I'm a graph person, and I found the following interesting to decipher. Government's throwing money at problems just disrupts market behaviour. When the Government intervention is removed, the market goes back to levels before their intervened.

Chart 7:
source: Australian Financial Review (analysis added)


D) Very low interest rates

Unfortunately, the four decade low interest rates set by the Reserve Bank of Australia has encouraged more and more Australian to take on ever larger mortgages. Lowering interest rates has had a very significant influence on keeping Australia’s housing prices upright during the GFC and post-GFC period. If the RBA did not intervene in the market to lower interest rates (essentially adding more liquidity, more Dollars to the market), than many Australian’s would not have entered the housing market, or bought addition properties. The RBA is nothing more than a market manipulator, to manipulate investors decisions and to disrupt real market information.


E) Double-digit M3 inflation growth

In one of my first posts in September 2008, I talked about money supply growth and that it was growing at the fastest annual rate since the 1970s. This was in part due to the housing bubble that has continued. But the dip in housing between March 2008 and March 2009, the drop in confidence during the GFC period, the rise in unemployable and underemployment,, and the reduction in bank lending in Australia cooled M3 growth. Right now the annualised rate is back to 5.7 per cent. So the volatility continues. I expect M3 to grow strongly once again (similar to 1970s), and ultimately will go crazy as Government's get desperate to bail out certain industries... Inflation always has a 12-18 month time lag... so even though it may be growing more slowly now, the overall costs of living continue to rise. I don't see milk or rents going down..


Other interesting tid bits:

Steve Keen walks to Kosciuszko from Canberra


Where to from here?

May 2010, the sharemarket is looking shaky with the Dow Jones breaking back below 10,000 point level. Housing market quarterly growth continues in Australia for now... But I ask, what has structurally changed from 2-3 years ago? Structurally nothing has changed in the world since before, during and after the GFC. The United States only continues to live beyond its means because it has the world reserve currency, and can print its way out of trouble for now. Europe, Japan and others have held up until now because confidence in private and government debt has been suffice to keep the current ponzi-fiat-monetary system going. People are waking up to this, and volumes of gold, silver and other so-called "relics" sales are going through the roof (mint-door sales). Real estate markets worldwide continue to fall in local-currency prices - Hong Kong, Mainland China, Israel and Australia are still the exception... for now. Deleverage of over-inflated asset prices will continue (derivatives....), and many more AIG, Lehman's are around the corner - this time Government names will be added to the list (just not officially). Australia looks good for now, but this can quickly change over night. Putting all our eggs in the one basket - superannuation, real estate and relying on exporting commodities to China will inevitably cause major problems for us (Australia). China's centrally planned economy will blow up, they cannot spend, spend, spend, just like the US tried to do with retail consumption and sub-prime. Populating, (retail) consumption and inflating our way through the GFC appears on face-value to work, but it is only postponing our problems: Aging population, consuming the future today (we have no private savings), and increasing our costs of living by diluting our money supply. Now is the time to find value in markets....... I don't think the next 20 yrs will be like the last 20 yrs. Printing money can only cover up so much for so long...

The great Australian dream will turn out to be nothing more than the Great Australian Ponzi Scheme.

Scott

Thursday, April 29, 2010

Paying debt with debt: The US can't continue to fund its empire

The United States economy remains in terminal decline. The Federal Reserve continues to print (or rather adding extra zeros on a computer) US Dollars in a vein attempt to restore confidence back into the fiat-monetary system. In step, the US Government continues to live beyond its means and pay for defence, social security and healthcare with imaginary money, debt and deficits remain king.They (The Fed and US Govt), need to print at an unprecedented rate to cover existing debts, recent debts that have been transferred to the public purse (AIG, Fannie Mae, Freddie Mac etc) and to cushion a wave a of new debts due to hit the world markets in the coming years. In essence the Fed will do anything to inflate asset prices at the expense of the cost of living for citizens in the US and worldwide. On the flip side, the Fed and US Government will do everything possible to manipulate the price of gold and silver to artificially prop up the value of the US Dollar and the fiat-US-reserve monetary system. This manipulation is a gift to those interested in cashing in on the major wealth transfer which will happen within the next decade – the transfer from infinite printing of (debt) cash/dollars to those holding finite resources such as gold, silver and ultimately producers of food.

If all this seems like a radical prediction, we need only look at the probabilities of the United States reversing its situation and funding its future liabilities.

As this US Debt clock demonstrates, the total US National debt has ballooned to almost US$13 trillion or US$117,000 debt for every tax payer. The US Government is collecting US$2.1 trillion in annual revenues, yet it now spend US$3.5 trillion annually. To put the final nail in the coffin, total future liabilities outstanding currently totals US$108 trillion (of this the Medicare liability is US$75 trillion). Some estimates are over US$120 trillion in liabilities. This amount with continue to compound, while the US has an aging demographic.

So for anyone who think the US can turn around this situation think again. Forget the spin around Obama, and his healthcare reform… his actions, and Presidents before him have made sure the US will end up defaulting on its debts and loose its luxury of being the world’s reserve currency (and buying the world’s resources for next to nothing – through printing endless US dollars).

If we had a more sound world monetary unit, the US would have went bankrupt many decades ago. In fact, the change of the monetary system in 1971, when President Nixon abandoned the Bretton Woods System, was essentially an admission that the US would default on its promise to convert its gold at US$35 ounce to other countries, if they so asked.

The current situation exists, as all the other major players still agree to participate in the current monetary system. China, Japan the UK and the many of the large oil countries continue to buy US t-notes (Government Debt). Indeed, the Federal Reserve, along with other central banks, US commercial banks, and major international banks continue to shuffle money around through over-the-counter derivatives to inflate and hide debts away from the scrutiny of the public. Sub-prime is at the very, very tip of a giant derivatives iceberg.


US Government Funding

* Nations buying US Federal Govt debt - see here. Australia has increased its US T-bill holdings by 77% in the last 12 months to US$14.4 billion. What are we thinking?


Pay the liabilities with money that doesn't exist

A historical timeline of US national debt can be seen here


* US Government interest on outstanding public debt

The US Government continues to pay hundreds of billions of dollars annually in interest on outstanding Government debt. In 2009, the US Government paid over US$383 billion in interest, about 8.5 per cent of total budget, and the fifth highest expenditure. Another way of looking at it, this is half the annual US defence budget! Remember, that the US is currently paying/using debt in a low interest environment, and that total debts and future interest payments will only compound at a faster rate in future years.

* Social Security

In March 2010, the New York Times reported that:
This year, the system will pay out more in benefits than it receives in payroll taxes, an important threshold it was not expected to cross until at least 2016, according to the Congressional Budget Office.
Check the government numbers here.


Plugging the existing holes

US mortgages

Chart : another wave coming?
source: Financial Review 1 March 2010


Fannie Mae and Freddie Mac

In February 2010, it was reported that Fannie Mae and Freddie Mac would require an additional $188 billion in government funds by October 2011, up from the $111 billion they have already drawn down. That does not count trillions in liabilities for the government-controlled firms.

For a background:
"Fannie Mae and Freddie Mac, which play a role in funding three-quarters of all U.S. residential mortgages, came under government control in September 2008 when they received a massive bailout that gave the government a 79.9 percent stake.
Late last year, the administration extended an unlimited credit line to the two companies through the end of 2012. Previously, the credit was capped at $400 billion."
The hypocrisy is that Freddie Mac made a full-year net loss of US$21.6 billion , whilst still paying dividend payments of US$4.1 billion to the US Treasury (on the senior preferred stock). Government's really know how to run businesses...

AIG

AIG still overflowing with debts, with a 2009 full-year net loss of US$11 billion.


US Bank Failures

The number of official bank failures, as reported by FDIC reached 141 in 2009. Already, 57 have officially gone under so far in 2010 (refer Chart below).

Chart 1: Number of bank failures in the US over last decade
When banks, or any other large company fails, its assets are resold for x cents in the dollar - could it be Federal Reserve acquainted banks buying many of the assets once held by these failed banks? Was it also coincidence Bear Stearns was bought by a Fed bank (JP Morgan) for $2 p/share, when just 12 months earlier it was valued by the market at $150 p/share.


Banking Bubble - the money can't hide in derivatives forever

As discussed back in 2008, the explosion in derivatives - complex financial products with underlying assets (ie. sub-prime CDOs), continues unabated.

Despite some debts coming to the forefront in recent years (US mortgages), the rate of bank lending (ultimately debt, and derivatives to cover up and pass on the debt) is growing at an unprecedented rate. The trendline in the chart below, was already growing quite strongly, but the last decade is clearly breathtaking (its not just the US banks, Chinese banks are part of the problem as well). A significant part of this lending spree went into housing bubbles around the world (some more notable than other)s. What markets could the banks inflate next? Commodities? (although China won't like this)

Chart 2: Banking Bubble led by the US Banks
source: ABC News

Satyajit Das summed it up in The Monthy (April 2009):
The most important lesson of the financial crisis may be that the current economic order was built to fail, for the global economy used debt and financial engineering to enhance growth, requiring ever more stimulus to maintain performance. The spike in debt globally caused a spike in growth rates. As much as $5 of debt was required to create $1 of growth. Approximately half the recorded of growth in the US over recent years was driven by borrowing against the rising value of houses (that is, mortgage-equity withdrawals). As the level of debt in the global economy decreases, attainable growth levels also decline.
Having another look at the largest 25 US Banks by derivatives exposure (to 31 Dec 2009), the total amounts of derivatives by US banks is still 3 to 4 times total world GDP (in US Dollars).

Chart 3:
source: US Department of Treasury

Whilst from first glance it appears the so-called GFC has done almost nothing to the amount of derivatives outstanding held by US banks. JP Morgan's position is down to $76 trillion (still well over the total amount of world-GDP which is around US$60 trillion). Another stand out, is that Goldman Sachs has been added to the list (after registering as a Commercial Bank from an Investment Bank). It's total credit exposure to capital is a crazy 766 per cent. Perhaps the S.E.C. (US Govt) should look under the bed a bit more... or is the recent fraud exercise a PR exercise to divert attention from other bank-debt-govt related problems?

All the above paints a storey that something is not right in the world's largest economy and that business-as-usual economics cannot continue indefinitely. The monetary system is broken, and we must prepare for a change of the guard (away from fiat currencies). Only a top-down approach starting with abolishing the federal reserve, its secrecy, and its illegal "behind-close-door" secret deals, than the US and the world can move forward with a more sound monetary system. In the meanwhile, the US dollar will continue to erode in purchasing power, along with all the world's fiats currency. Tangibles (gold, silver) are still in the early stages of a once-in-a-life-time super-boom.

Cheers
Scott

Monday, March 8, 2010

Commodities Update - March 2010

Just some quick charts this time

Chart : Copper


Chart : Nickel


Chart : Zinc


Chart : Aluminium


Chart : Baltic Dry Index (BDI)


Chart : Iron Ore

Source: ABC News, March 10

Chart : Coal

Source: ABC News, March 10