Thursday, May 28, 2009

There isn’t enough silver to go around

To date I haven’t posted much on gold and silver, a subject I intend to spend more time on in the near future (particularly on gold companies in Australia).

The following is extracts from one of the best silver articles I have read to date, from well-known silver commentator, Ted Butler. I encourage all to read the full article titled, A Presidential Bombshell.

Here is a quick summary of some of the points made in Ted’s article.

In the United States:
- In 1959, the US Treasury Department held approximately 2.1 billion ounces in silver bullion inventories plus 1.3 billion ounces in circulating coinage, for a total of 3.4 billion ounces of silver.
- By 1971, the Treasury held only 170 million ounces of silver bullion and most silver coins were removed by investors from circulating coinage and eventually melted into bullion.
- In only 12 years, the US Government transferred 94 percent of its holdings to the private sector (over 3.2 billion ounces).
- The US Government became a net buyer of silver again in 2001 to mint American Silver Eagles.
Silver per-capita
In the United States:
- In 1959, there was almost 19 ounces of silver for every person in the United States.
- Today the U.S. has no government reserves of silver.

Worldwide:
- in 1959 there were about 9 billion ounces of silver bullion in the world, with a population of 3 billion, there was a per-capita amount of 3 ounces for each of the world’s citizens.
- Today, there is a per-capita amount of silver of 0.15 of an ounce per person (1 billion ounces divided by 6.8 billion population).
- By way of comparison, the per-capita amount of gold bullion equivalent in the world has remained remarkably stable at around three-quarters of an ounce per person, for more than 100 years.
So if you hold just one 1-ounce silver bullion coin today, consider yourself wealthy. Likewise if you hold just 1 ounce of gold.

Further in Ted’s commentary on May 11, he quoted a speech from President Lyndon Johnson which was made on July 23, 1965. This is what President Johnson said:
"Now, all of you know these changes are necessary for a very simple reason--silver is a scarce material. Our uses of silver are growing as our population and our economy grows. The hard fact is that silver consumption is now more than double new silver production each year. So, in the face of this worldwide shortage of silver, and our rapidly growing need for coins, the only really prudent course was to reduce our dependence upon silver for making our coins.
If we had not done so, we would have risked chronic coin shortages in the very near future.
Some have asked whether our silver coins will disappear. The answer is very definitely-no.
Our present silver coins won't disappear and they won't even become rarities. We estimate that there are now 12 billion--I repeat, more than 12 billion silver dimes and quarters and half dollars that are now outstanding. We will make another billion before we halt production. And they will be used side-by-side with our new coins.
Since the life of a silver coin is about 25 years, we expect our traditional silver coins to be with us in large numbers for a long, long time.
If anybody has any idea of hoarding our silver coins, let me say this. Treasury has a lot of silver on hand, and it can be, and it will be used to keep the price of silver in line with its value in our present silver coin. There will be no profit in holding them out of circulation for the value of their silver content."

Silver is rare. It's so rare, 99 out of 100 people wouldn't know about it. It’s a finite store of value with no debt or liability attached to it. Unlike gold it is also an industrial metal as well as a monetary metal. In 1959 President Johnson used the word’s “world shortage” and “silver is a scare material”. Less than 15 years after those worlds the price of silver rose from US$1.29 to more than US$50 in 1982. In 1959 there was 9 times more silver and 3.8 billion extra people than today! – so why don’t we hear stories of silver’s extreme rarity today? We only get a handful of gold reports on the news, and it will always be referred to in USD terms. Apparently the world is flat, not round.

Silver has become so rare for the first time in human monetary history there is more than four to five times more silver above ground than gold. Even more amazing is that silver has been manipulated so much by Governments, and commercial banks that it remains dramatically undervalued compared to gold. The silver market in dollar terms is one of the smallest and easiest commodity markets to manipulate. Total above ground silver is currently worth US$12 billion at current prices compared to almost US$4 trillion for gold. Keep in mind there is about 1 billion ounces of silver, and 4 to 5 billion ounces of gold. Something is not right here.

Gold-Silver Ratio

The historical gold/silver ratio (over many centuries) was around 15 to 1. The primary reason is that silver was around 15 times more abundant in the earth's crust than gold. Today the gold silver ratio is 80 to 1, almost double the average for the last 200 years of 33, and the average of 20th century average of 47.

Chart 1: Gold Silver Ratio over last 200 years
With available silver more rare than gold, silver has considerable gains to record. Gold will do very well, but silver should provide exceptional returns within the next decade. Another way to put it, the purchasing power of silver should rise greater than the purchasing power of gold. Some analysts believe silver will get to a gold/silver ratio of 1:1 within our lifetime. I think this is highly plausible and not out of the question.

Something has been keeping the silver price down for many years... It's Government, Central Bank and Commercial Bank manipulation... I will go into more depth another time, in the meantime Ted Butler's weekly commentary website is worth a bookmark.

- Scott

Monday, May 25, 2009

House Price Expectations – May 2009

The latest Westpac–Melbourne Institute Sentiment Survey asked an extra question this month on consumer expectations for house prices over the next 12 months.

All in all, across all categories consumers are currently balanced between those expecting a fall in price, those expecting a rise, and those who think prices will stay around the current levels.

What is most interesting from the survey:

Chart 1:
By State:
- Consumers in NSW and Vic were notably more bullish on prices with a net 6.9% and 2.1% expecting prices to rise respectively.
- Conversely the Resource rich states of Queensland and Western Australia were the most pessimistic. WA had the highest proportion of 'extreme' pessimists with 9.4% of respondents picking a decline of 10%+.


Chart 2:By household income:
- Those on low incomes ($21 to $30K p.a) were the most optimistic of house price increases, while those with an annual income of $81 000–$90 000 were the most pessimistic.


Chart 3:
By Age Group:
- Generation X and Y continue to be the most optimistic age group (those aged 18 to 34 in the survey) expecting house prices to rise.
- Those aged 45 to 54 on balance expect house prices to decline in the next 12 months.

Concluding statement from survey:
“Despite record low interest rates and rising rental yields, demand from investors has remained subdued to date. Price expectations appear to have been the crucial 'missing ingredient' with potential buyers in this segment still clearly very wary about the potential for significant price declines.”

What can be drawn from this?

This closing statement (above) from the Westpac–Melbourne Institute survey is spot on. I have been arguing about this “missing ingredient” for some time. It is the elephant in the room which many would-be home buyers have not been taking into consideration. More importantly, I would go further and say that purchasing power expectations is the missing ingredient with potential home buyers. I expect both price and purchasing power (relative to other investments) to continue to decrease for Australian houses.

Unsurprisingly the younger generations are those who continue to be most optimistic about future house prices. After all, we are the generation which has been offered free home owner grants on a platter from the Federal and State Governments. Most of us under 35 are too young to remember the last recession in the early 90s. Why would we expect the future to be worse? We have been conditioned to believe the economy will always get bigger and better.

The Baby Boomer generation, those who have a lot more of the property, have more buying power than the younger generations (due to nearing their working life as opposed to starting) and are more pessimistic about house prices. This should be of considerable concern. This demographic has a lot more financial leverage than the X & Y generations. When sellers outnumber buyers (just on demographics) there is a long-term problem for properties and business prices.

I also discussed previously on my blog in more depth on the great Australian housing bubble (see here). I stated that the resource states would be the first to really feel housing price pain. I used the example of a person earning over $100,000 per annum driving a truck at a fly-in fly-out iron ore mine in Western Australia. This person took on a large mortgage in inner Perth on the expectations that they would continue to work in the $100K job for many years to come. As expected, just like the mining bust, Perth is now out in front leading the housing crash (in both actual house price falls and future price fall expectatiosn). Over the longer term, I believe Canberra will be the last capital city to experience the worst of the falls due to it’s reliance on Government jobs, rather than business-oriented jobs, which is what the economy really needs. It is by no means immune. All house prices have a common denominator - debt.

- Scott

Thursday, May 21, 2009

Accounting for deadwood

One of Australia’s great ponzi schemes is toppling. In the last two months, the two largest Managed Investment Schemes (MIS) have entered administration; Timbercorp (23 April 2009) and Great Southern Plantations (15 May 2009). Fortunately these companies have been allowed to fail. The market is accounting for deadwood in the system.

The MIS industry prospered over the last decade purely as more investment flows came into the companies each year by paying high short-term returns at the expense of long-term balance sheet sustainability (from future profits).

In many ways, the MIS industry is akin to the Babcock and Brown or Allco Finance model. Take low yielding assets that have a long investment time frame, sell the assets to investors on the sharemarket, inflate the yield numbers over the short term, and skim large amounts of fees off the top. This model worked brilliantly when the economy (and the money supply/credit/debt) grew consistently and individuals looked for investments to expand their wealth. Now the debt model is broken and the MIS industry has been exposed as a complete fraud.

However, the real fuel on the fire was the lure of a tax break. The tax rules on MIS schemes in the 1990s early 2000s made it ideal for investors who wanted both an investment and a way to minimize tax. In a way it was a voluntary savings scheme (similar to Superannuation), the scheme mangers were almost guaranteed to get a growing number of buyers for their schemes each year.

Like all ponzi schemes, the system starts to show huge cracks when the liquidity of buyers starts drying up.

The first major crack was an ATO crackdown in February 2007, which prevented non-forestry MIS (such as almonds, olives) from receiving upfront tax deductions. The increased uncertainty created from this no doubt have a significant impact on the financial sustainability of the MIS industry.

The second crack was under delivering investors. When the first timber projects were harvested, yields were well down on what investors were told a decade earlier. The assets (the trees) were considerably less valuable.

Third, both Great Southern and Timbercorp took on substantial debts to keep the schemes going. Taking on large debts (with less investor equity) in the boom times worked (ala B&B model). As we know with the Global Financial Crisis (GFC), debt-based models are no longer sustainable and companies are now rushing to raise equity at any cost. The MIS could no longer raise any credible equity or debt and the great ponzi scheme has been felled.

It turns out Timbercorp and Great Southern became the biggest of the MIS schemes because they were the best at selling schemes (with the tax break lure). As it turns out, they weren’t in the business of making fat profits via harvesting – ie. what investors were led to believe.

As an example of the largess of the industry, Great Southern spent $62.3 million on commissions, marketing and promotion of its products in the year to September 2008.

However, despite the commissions, fees, tax breaks and other incentives, lets not forget that the agriculture and forestry industry, like any investment, has risk.
The risk/reward relationship changed for the MIS industry substantially over the last 10 years. Risks were overlooked in the earlier years because of the lure of the tax break. Without the tax break, it is now known that TIM and GTP were high risk/low (no) reward investments.

Further, Agriculture and forestry is susceptible to serve weather conditions, particularly drought. This has no doubt impacted on expected yields and expected future profits. The 62,000 investors caught left holding worthless paper when the music stopped, like any investor, have to take personal responsibility for their investments. The financial/investment industry has its fair share of bad advisors who give bad advice on bad investments. Economists also don't have a crystal ball about he future on tax changes, climate influences etc. Investing is also about timing and discipline. Every investor must have an exit strategy for when things start to go wrong. As we now know the investment world no longer tolerates high debt companies. For instance, Timbercorp had debt gearing of 62.4 per cent in 2007. The charts of both Great Southern and Timbercorp show investors have been deserting the companies for the last 3 to 4 years.

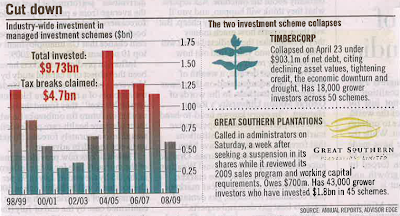
All up over $10 billion in investment flows went into the MIS industry over the last decade, with and estimated $4.7 billion in tax breaks received.

As the following graphic details, Timbercorp fell with over $900 million in debts, while Great Southern owes around $700 million.

Chart 1: Total invested in MIS in last decade
source: Financial Review, 19/05/2009, page 61

Chart 2: Timbercorp’s investmentssource: Timbercorp website

Chart 3: Great Southern’s investmentssource: Great Southern website


Deflation to hit rural property prices

I’ve discussed a number of times that I believe there were continue to be deleveraging of debt across Australia and the world. All types of property in Australia are at high, immediate asset-deflation risk (commercial, industrial, residential and rural properties).

The collapse of the two largest MIS schemes should have a significant impact on rural land prices across Australia. During the last decade, MIS has been criticised by many rural communities for pushing up land prices (due to their investor and bank backed purchasing power) and accelerating the decline of many rural communities. Traditional farmers could not compete on land purchases, and many of the best grazing properties were turned into hardwood plantations.

Now with the collapse of Great Southern and Timbercorp there is talk of an immanent fire sale. Great Southern has 240,000 hectares, while Timbercorp has 120,000 hectares of property. Just like a bank taking back a default home mortgage, they will not be interested in holding onto all this surplus property. It will be dumped onto the market for whatever price they can get. We now have a reverse outcome to the last decade. The buying force of a the MIS industry pushed prices up dramatically, are now crossing over to the seller side. When administrators/banks are the sellers, lookout below… Severe asset-deflation is coming. The only hope is if a major foreign investor showed up to buy most of the assets.

Debt will continue to be the downfall for many individuals, businesses, and even Governments. Timing and discipline is key. We are no longer in a debt cycle.

- Scott

Friday, May 15, 2009

But house prices are supposed to always go up…

The latest ABS quarterly House Price Index (March 2009) for established houses show continued falls in five of Australia’s eight capital cities.

• The average decline across the eight cities for the 12 months till March 09 was – 6.7 per cent.
• The House Price Index has now fallen for the past four consecutive quarters.
• On an annual basis, only Darwin and Hobart prices have increased in price.
• Perth continues to be the worst performing market with a quarterly fall of – 3.6 per cent, with an annual fall of – 10.1 per cent.

Chart 1: Year on year and quarterly established house prices by capital city
The following graph gives a better picture of what has been happening to Australian house prices in the last 5 years.

Chart 2: Year on year Australian established House Prices
Source: ABS

But housing prices are always supposed to go up… right?
They said, "Buy now, or be priced out... FOREVER"

Cheers
Scott

Tuesday, May 5, 2009

The Inflation vs. Deflation Debate

There are a lot of articles going around about whether the world economy is facing Inflation or Deflation. Here is my take on the situation.

It’s asset-deflation

Deleveraging of financial assets worldwide has been driving short-term deflationary pressures on world money supply. I label this as asset-deflation or debt-deflation. Deflation has a snowballing effect. It comprises of:

a) Illiquidity
. When buyers hit the sidelines on expectations that prices will fall lower in the future.

b) Spreads Widen. With buyers drying up, the difference between what the nearest buyer is willing to pay and what the seller expects to get paid widens. For example, someone may believe their house is worth $500K, but the nearest buyer is now at $400K, causing a spread of $100K. In other words, the house is only worth what the nearest buyer is willing to pay!

c) Many sellers exit the market at almost any cost. In a rising market, buyers out bid each other to acquire an asset. In a deflation environment, many sellers are forced into a position to sell to the nearest buyer (even though it may be vastly under what they believe their asset is worth). There doesn’t need to be many sellers in an illiquid market to make prices fall sharply (just like a lack of buyers). For example, if someone forecloses on their mortgage, the bank will offload the property back onto the market and get what ever it can. As unemployment rises, mortgage default rises, the quantity of surplus properties in bank hands rises. This causes more asset-deflation.

Baby Boomers

More so in the future, demographics will be a major influence on asset-deflation. The Baby Boomer generations is the largest living generation in the United States, Australia and many Western economies. As they move into retirement at the end of their working life, many will sell down their properties, businesses, and shares (held in the Superannuation accounts). However the following generations will be unable to match this selling pressure as they are starting our/half way into their working life. This factor alone will ensure the next 20 years will be vastly different to the last 20 years for financial (DEBT) driven assets.


Asset-deflation should be embraced

Prices have been lifted artificially high for too long, and now the market forces are accounting for misallocation of capital.

Governments, central banks, commercial banks and individuals fear asset-deflation. This is why the Australian Government is guaranteeing deposits, the States debt, forming a Rudd-bank (commercial property fund). The aim of the Federal Reserve (and central banks worldwide) is to ensure property has soft landing so people feel wealthy again. They now want to prevent massive asset bubbles from bursting as it will destroy the artificial wealth effect.

artificial wealth effect - the general population get angry when food prices, rent prices continually inflate (because of an expanding money supply), but also dislike when the sharemarket and property values fall in price (again, due to an expanding money supply). We can’t have it both ways.

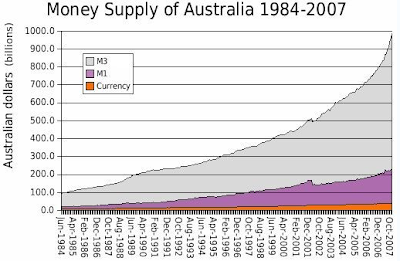
Historically property prices are said to double every seven years. What is never mentioned is how much the money supply has grown every seven years, or how our purchasing power has decreased every seven years. For example, if you buy a property for $100K in 1988 and sell it for another house in the surrounding suburb, you would have to pay around $100k for a similar house. Come forward to 1998, that same house is now worth $200K, but if it were sold, you would still have to buy a similar house in that area for around $200K. House prices have doubled in this 10 year example, but overall purchasing power decreased as the M3 money supply more than doubled. This is an artificial wealth effect.

A couple more points. The 1970s and 1980s were ideal times to acquire and invest in property and the sharemarket. The market was in a Debt-cycle. From 1982 to 1999, commodities were largely lousy investment and lost purchasing power. The two cycles have an inverse relationship. We currently remain halfway through an average commodity cycle. The purchasing power gains will continue to occur for gold, silver and most commodities, while the purchasing power of investing in the sharemarket and property will continue to decrease.


By design the system must inflate

The monetary system is designed to inflate over time and reduce our purchasing power. The system is mathematically designed on an exponential growth curve.
These factors include: fractional reserve banking, mandatory savings scheme, government monetary/fiscal power.


i) fractional reserve banking
.
Every time someone signs a new mortgage or a new bank loan, new money is created right there and then. Fractional reserve banking is at the heart of the flaws in today’s monetary system. By design, all debts can never be repaid. Exponential credit (debt) is guaranteed. Therefore many nations, businesses, individuals will remain in spirally debts and bankruptcies.

“The most powerful force in the universe is compound interest” - Albert Einstein

ii) mandatory savings scheme (Superannuation)
Superannuation, Government Funds (such as the Future Fund) artificially inflate asset prices over time as they provide excess liquidity to the market and a guaranteed source of continual investment. By design, these schemes also need asset prices to inflate in price.

iii) Government monetary and fiscal power
The reason we have such extreme volatility in the economy is that Governments central banks, commercial banks try to re-inflate bubbles whenever market forces try to account for bad debts through asset-deflation. Central banks (through monetary policy) around the world are currently lowering interest rates in a desperate attempt to manipulate investor decisions, to draw more financially able investors into the asset-deflation black hole. Central banks/Governments aren’t lowering interest rates so people buy more food or enter the rent market. The monetary framework today is all about saving the PRICE of financial assets (debt).

Through fiscal policy, Governments are giving financial incentives (free handouts - free as in using taxpayer money…), such as the first home owner grant to artificially keep house prices high. In the future (its already happening…), these insentives will be funded by Government-debt.

These actions ensure the longer-term money supply will inflate over time and that debts will become increasingly unsustainable.

iii) a) the US Government is insolvent

The US Government currently has a national debt of US$11.2 trillion. Right now the US Government is spending almost. In 2008, the interest repayments on the national debt is US$431 billion (around 14 percent of the annual budget). When you add future liabilities (of an aging 80 million US baby boomers) such as Medicare, Medicaid and social security – debt liabilities total over US$65 trillion.

The US Government cannot escape its debt situation without borrowing more debt. The Government will never consider reducing Medicare or pension liabilities. The result – more money has to be created, and purchasing power must continue to decrease.


Cause and Effect

Economics is all about cause and effect. Unfortunately many (including our current PM) do not understand both elements.

Fractional reserve banking, mandatory savings scheme and Government monetary and fiscal power are all causes. The consequence is Inflation (loss of purchasing power).

Likewise, many journalists continue to ignore the root causes of deflation, but are fixated on reporting the effects of (asset) deflation. For instance, many are now writing up articles about how wages are falling across many Western economies. Wages just don't fall on their own. Wages are falling as a consequence of something else happening. That is, businesses are collapsing due to DEBT, the drying up of liquidity in markets (including debt markets) and as a result, demand is collapsing. Consequently, as the number of unemployed rise, wages come under pressure as they should.


The CP”lie” – is money supply deflating?

Another mechanism now entrenched in today’s monetary system is the constant dilution (manipulation) of Government statistics. Unfortunately Governments and media are now fixed on the Consumer Price Index (CPI or CP-“lie”). It’s the intention of Governments (and thus the media) that it is possible to sell the idea of deflation through manipulated statistics (particularly CPI).

Currently in Australia, the official CPI rate is 2.5 per cent.


Australia’s money supply is still inflating

In the year to March 2009, Australia's money supply:

Broadmoney 12.4 per cent;
M3 increased by 15.1 per cent;
M1 increased by 8.1 per cent.

There is no deflation in the money supply numbers. It's all on the RBA website. It's the media's fixation on CPI that a drastically diluted scenario is continued to be created. We will never hear what real inflation is doing through the mainstream media.

Chart 1: Exponential curves keep expanding
source: Wikipedia

Chart 2: A chart from my second post last year.
The above chart shows the annual grow rates of Australia's M3 money supply. It's not a conincidence that both the sharemarket and property market continued to bubble in the last couple of years (as M3 grew at a faster rate). Expect M3 volatility like the 1970s over the next couple of years (at least).


Japan’s decade of deflation?

Money supply has consistently increased in Japan during the last couple of decades whilst it has experienced deflationary pressures. Asset prices (property, sharemarket remain well below the bubble levels of the 1980s). As the following chart shows, the inflator mechanisms of fractional reserve banking, monetary and fiscal policy etc have meant that Japan's money supply has continued to grow even those asset prices are still subdued.

Chart 3: But the money supply is still growing?
source: Wikipedia

Japan has already been through much of what the Western World is now facing: significant asset-deflation. (Obviously there were other issues going on such as the zombie banks, several stimulus measures etc which I will go into more depth another time).

Summary:

Assets worldwide are being deleveraged and revalued by the market. Asset-delfation is healthy and should be embraced by Governments, banks and individuals worldwide. The market is accounting for excess money and debt in the system.

In Australia the current CPI is 2.5 per cent p.a., banks are offering around 4 per cent interest for savings. Official M3 data shows overall money supply inflation is 15 per cent p.a.
- Aren’t our savings going dramatically backwards in the bank?
- The RBA shouldn’t be reducing interest rates!

Ultimately when it comes down to the inflation/deflation debate, ask yourself this:

* Will the Australian Dollar (or other fiat currency) increase or decrease its purchasing power in the next couple of years? (in this "deflationary" environment). How much stuff will it buy in the future compared to today. This is the crux of the issue.

Remember there is a huge difference between price and value.

- Scott